
![]()
FIRST QUARTER 2025
Plymouth REIT
Supplemental
Information
|
FIRST QUARTER 2025 Plymouth REIT
|
Q1 2025 Supplemental | 1
![]()
Table of Contents
| Table of Contents | |
| Executive Summary | 4 |
| Company Overview, Management, Board of Directors, and Investor Relations | 4 |
| Portfolio Snapshot | 5 |
| Total Acquisition and Replacement Cost by Market | 5 |
| Acquisition Activity | 6 |
| Development Projects | 7 |
| Value Creation Examples | 8 |
| Guidance | 9 |
| Financial Information | |
| Consolidated Balance Sheets | 11 |
| Consolidated Statements of Operations | 12 |
| Non-GAAP Measurements | 13 |
| Same Store Net Operating Income (NOI) | 15 |
| Debt Summary | 16 |
| Capitalization and Capital Markets Activity | 17 |
| Net Asset Value Components | 18 |
| Joint Venture | 19 |
| Rentable Square Feet and Annualized Base Rent by Market | 20 |
| Operational & Portfolio Information | |
| Leasing Activity: Lease Renewals and New Leases | 22 |
| Leasing Activity: Lease Expiration Schedule & % of Annual Base Rent Expiring | 23 |
| Leased Square Feet and Annualized Base Rent by Tenant Industry | 24 |
| Leased Square Feet and Annualized Base Rent by Type | 25 |
| Top 10 Tenants by Annualized Base Rent | 26 |
| Lease Segmentation by Size | 27 |
| Capital Expenditures | 28 |
| Appendix | |
| Glossary | 30 |
Q1 2025 Supplemental | 2
![]()
Disclaimers
References herein to “we,” “us,” and “our” refer to Plymouth Industrial REIT Inc. (“Plymouth” or the “Company”)
Forward-Looking Statements
This Supplemental Information contains forward-looking statements that are made pursuant to the safe harbor provisions of Section 27A of the Securities Act of 1933, as amended and of Section 21E of the Securities Exchange Act of 1934, as amended. The forward-looking statements in this Supplemental Information do not constitute guarantees of future performance. Investors are cautioned that statements in this Supplemental Information, which are not strictly historical statements and include, without limitation, statements regarding management's plans, objectives and strategies, constitute forward-looking statements. Such forward-looking statements are subject to a number of known and unknown risks and uncertainties that could cause actual results to differ materially from those anticipated by the forward-looking statement, many of which may be beyond our control, including, without limitation, those factors described under the captions “Cautionary Note Regarding Forward-Looking Statements” and “Risk Factors” in the Company’s Annual Report on Form 10-K and Quarterly Reports on Form 10-Q filed with the Securities and Exchange Commission. Forward-looking statements generally can be identified by the use of forward-looking terminology such as “may,” “plan,” “seek,” “will,” “expect,” “intend,” “estimate,” “anticipate,” “believe” or “continue” or the negative thereof or variations thereon or similar terminology. Any forward-looking information presented herein is made only as of the date of this Supplemental Information, and we do not undertake any obligation to update or revise any forward-looking information to reflect changes in assumptions, the occurrence of unanticipated events, or otherwise.
Definitions and Reconciliations
For definitions of certain terms used throughout this Supplemental Information, including certain non-GAAP financial measures, refer to the Glossary on pages 30-35. For reconciliations of the non-GAAP financial measures to the most directly comparable U.S. GAAP measures, refer to page 13-14.
Q1 2025 Supplemental | 3
![]()
Executive Summary
Company Overview
Plymouth Industrial REIT, Inc. (NYSE: PLYM) is a full service, vertically integrated real estate investment company focused on the acquisition, ownership, and management of single and multi-tenant industrial properties. Our mission is to provide tenants with cost effective space that is functional, flexible and safe.
Management, Board of Directors, Investor Relations, and Equity RESEARCH Coverage
|
Corporate 20 Custom House Street Boston, Massachusetts 02110 617.340.3814 www.plymouthreit.com Investor Relations John Wilfong SCR Partners IR@plymouthreit.com Continental Stock Transfer 1 State Street, 30th Floor New York, NY 10004 212.509.4000 |
Executive Management Jeffrey E. Witherell Chief Executive Officer Anthony J. Saladino President James M. Connolly Executive Vice President Lyndon J. Blakesley Senior Vice President |
Benjamin P. Coues Senior Vice President Anne A. Hayward, ESQ. Senior Vice President Daniel R. Heffernan Senior Vice President Scott L. Robinson Senior Vice President |
Board of Directors Phillip S. Cottone Independent Director Richard DeAgazio Independent Director David G. Gaw Lead Independent Director John W. Guinee Independent Director
|
Caitlin Murphy Independent Director Robert Stephenson Independent Director Pendleton P. White, Jr. Director Jeffrey E. Witherell Chief Executive Officer
|
Equity Research Coverage1 Baird Nicholas Thillman 414.298.5053 Barclays Brendan Lynch 212.526.9428 BMO Capital Markets John Kim 212.885.4115 BNP Paribas Exane Nate Crossett 646.725.3716 Colliers Securities Barry Oxford 203.961.6573 |
JMP Securities Mitch Germain 212.906.3537 J.P. Morgan Mike Mueller 212.622.6689 KeyBanc Capital Markets Todd Thomas 917.368.2375 Truist Securities Anthony Hau 212.303.4176 Wedbush Securities Richard Anderson 212.931.7001 |
Investor Conference Call and Webcast
The Company will host a conference call and live audio webcast, both open for the general public to hear, on May 2, 2025 at 9:00 a.m. Eastern Time. The number to call for this interactive teleconference is (844) 784-1727 (international callers: (412) 717-9587). A replay of the call will be available through May 9, 2025 by dialing (877) 344-7529 and entering the replay access code, 3304674.
| 1 | The analysts listed provide research coverage on the Company. Any opinions, estimates or forecasts regarding the Company's performance made by these analysts are theirs alone and do not represent opinions, estimates or forecasts by the Company or its management. The Company does not by reference above imply its endorsement of or concurrence with such information, conclusions or recommendations. |
Q1 2025 Supplemental | 4
![]()
Highlights
As of March 31, 2025
Wholly-owned Portfolio Snapshot
| Number of Properties | 133 | |
| Number of Buildings | 204 | |
| Square Footage | 30,018,524 | |
| Portfolio Occupancy | 94.3% | |
| Same-Store Occupancy | 94.7% | |
| WA Lease Term Remaining (yrs.)1 |
3.0 | |
| Multi-Tenant as % of ABR |
58.1% | |
| Single Tenant as % of ABR |
41.9% | |
| WA Annual Rent Escalators |
~3.1% | |
| Triple Net Leases as % of ABR |
82.6% | |
| 1 The average contractual lease term remaining as of the close of the reporting period (in years) weighted by square footage. | ||
Total Acquisition and Replacement Cost by Market
($ in Thousands)
| Market | State | # of Buildings |
Rentable Square Feet |
Total Acquisition Cost1 |
Replacement Cost2 |
| Atlanta | GA | 14 | 2,384,418 | $ 135,888 | $ 181,762 |
| Boston | ME | 2 | 268,713 | 19,023 | 40,729 |
| Charlotte | NC | 1 | 155,220 | 20,400 | 20,821 |
| Cincinnati | OH, KY | 26 | 3,472,704 | 168,005 | 299,488 |
| Cleveland | OH | 19 | 3,979,209 | 201,550 | 362,436 |
| Columbus | OH | 14 | 3,230,487 | 137,624 | 257,186 |
| Indianapolis | IN | 17 | 4,085,169 | 149,251 | 356,416 |
| Jacksonville | FL, GA | 29 | 2,185,316 | 159,621 | 226,330 |
| Memphis | MS, TN | 62 | 6,370,599 | 283,807 | 584,233 |
| South Bend3 | IN | 6 | 667,000 | 26,001 | 37,830 |
| St. Louis | IL, MO | 14 | 3,219,689 | 213,787 | 325,818 |
| Total | 11 | 204 | $ 30,018,524 | $ 1,514,957 | $ 2,693,049 |
| Unconsolidated 3 | |||||
| Chicago | IL, WI | 34 | 5,957,335 | 253,750 | 681,298 |
| 1 | Represents total direct consideration paid prior to the allocations per U.S. GAAP and the allocated costs in accordance with GAAP of development properties placed in-service. |
| 2 | Replacement cost is based on the Marshall & Swift valuation methodology for the determination of building costs. Replacement cost includes land reflected at the allocated cost in accordance with GAAP. |
| 3 | During Q4 2024, Plymouth contributed 34 of the 40 buildings in our Chicago market to the Chicago Joint Venture with Sixth Street. The remaining 6 buildings in the market more closely align with the CBRE defined market of South Bend, IN. |
Q1 2025 Supplemental | 5
![]()
Acquisition Activity
Acquisitions ($ in Thousands)
| Location | Acquisition Date |
# of Buildings |
Purchase Price1 |
Square Footage |
Projected Initial Yield2 |
Cost per Square Foot3 |
| Atlanta, GA | 3/13/2025 | 1 | $ 23,874 | 297,583 | 6.8% | $ 80.23 |
| Cinicinnati, OH | 3/13/2025 | 4 | 17,851 | 240,658 | 7.0% | 74.18 |
| Cinicinnati, OH | 2/20/2025 | 1 | 23,300 | 263,000 | 6.7% | 88.59 |
| Total First Quarter 2025 Acquisitions | 6 | $ 65,025 | 801,241 | 6.8% | $ 81.16 | |
| Multiple | Full Year 2024 | 23 | $ 120,649 | 1,879,323 | 7.8% | $ 64.20 |
| Multiple | Full Year 2022 | 44 | 253,655 | 4,164,864 | 6.1% | 71.54 |
| Multiple | Full Year 2021 | 24 | 370,977 | 6,380,302 | 6.7% | 63.15 |
| Multiple | Full Year 2020 | 27 | 243,568 | 5,473,596 | 7.8% | 46.99 |
| Multiple | Full Year 2019 | 32 | 220,115 | 5,776,928 | 8.4% | 42.21 |
| Multiple | Full Year 2018 | 24 | 164,575 | 2,903,699 | 8.2% | 70.54 |
| Multiple | 2017 (since IPO) | 36 | 173,325 | 5,195,563 | 8.4% | 33.81 |
| Total Acquisitions Post-IPO | 216 | $ 1,611,889 | 32,575,516 | 7.4% | $ 49.48 |
Note: Acquisitions include wholly-owned industrial properties only; excludes our property management office located in Columbus, Ohio.
| 1 | Represents total direct consideration paid rather than GAAP cost basis. |
| 2 | We define Projected Initial Yield as calculated by dividing the Company’s estimate of year 1 cash net operating income from the applicable property’s operations by the Purchase Price. Total Projected Initial Yield is weighted based on Purchase Price. |
| 3 | Calculated as Purchase Price divided by square footage. |
Q1 2025 Supplemental | 6
![]()
Development Projects
As of March 31, 2025
The total investment in completed developments is approximately $70 million. The initial cash NOI yields on development projects completed is 7.5%.
Plymouth is in the early stages of constructing a 41,958-square-foot building on the last remaining plot in our Jacksonville, FL Liberty Business Park. The estimated investment is $5.7 million with a targeted completion date at year end 2025.
Plymouth has partnered with the Green Building Initiative to align our environmental objectives with the execution of all new development and portfolio enhancement activities. Plymouth achieved a Three Green Globe certification on our Cincinnati development and a Two Green Globe certification on our completed developments in Boston, Jacksonville and Atlanta1. |
Completed2 |
# of Buildings |
Total Rentable Square Feet (RSF) |
% Leased |
Investment ($ in millions) |
% Funded |
Completed |
| Boston - Milliken Road | 1 | 68,088 | 100% | $ 9.3 | 100% | Q4 2022 |
| Atlanta - New Calhoun I | 1 | 236,600 | 100% | 13.8 | 100% | Q1 2023 |
| Cincinnati - Fisher Park I | 1 | 154,692 | 100% | 14.0 | 100% | Q1 2023 |
| Atlanta - New Calhoun II | 1 | 180,000 | 100% | 12.1 | 100% | Q3 2023 |
| Jacksonville - Salisbury | 1 | 40,572 | 100% | 6.2 | 100% | Q3 2023 |
| Jacksonville - Liberty I | 1 | 39,750 | 100% | 5.7 | 100% | Q4 2023 |
| Jacksonville - Liberty II | 1 | 52,920 | 100% | 8.9 | 100% | Q4 2024 |
| Total | 7 | 772,622 | 100% | $ 70.0 | 100% |
| 1 | The Company is a member organization of the Green Building Initiative (GBI), a nonprofit organization and American National Standards Institute (ANSI) Accredited Standards Developer dedicated to reducing climate impacts by improving the built environment. Founded in 2004, the organization is the global provider of the Green Globes and federal Guiding Principles Compliance certification and assessment programs. |
| 2 | Completed buildings are included within portfolio occupancy and square footage metrics as of March 31, 2025. |
Q1 2025 Supplemental | 7
![]()
Value Creation Examples
| Columbus: Capitalized on Below Market Rent | MEMPHIS: Recycling Capital | CINCINNATI: New Acquisition | ||
 |
 |
 | ||
|
Executed a renewal on 314,736 square feet for five years, with no tenant improvements, and a 64.5% rental rate increase over expiring rent. Building was acquired at a going-in yield of 9.0% in October 2020 for $10.5 million with in place rents well below market rates. Stabilized yield is now 14.6% with annual lease escalations of 3%. |
Sold a 33,688-square-foot flex building in Memphis, TN to an end user at a price of $2.4 million. The building was part of a portfolio Plymouth acquired in July 2024 for $100.5 million. This was a non-core asset leased on a short-term basis to a tenant known to be vacating at year end. The sale proceeds will be retained within the portfolio to fund leasing activities and the ongoing conversion of a 106,000-square-foot call center building back to its original warehouse format to accommodate multiple industrial users. |
During the quarter, acquired the second tranche of the previously announced Cincinnati small bay industrial portfolio consisting of four buildings totaling 240,678 square feet. $17.9 million, representing an initial estimated net operating income (“NOI”) yield of 7.0%. The portfolio was acquired for $17.9 million at a going-in NOI yield of 7.0%. The portfolio is 100% leased to ten tenants, with a weighted average remaining lease term of 3.5 years. In-place rents are consistent with our portfolio average mark-to-market of 18% to 20%. |
Q1 2025 Supplemental | 8
![]()
Guidance
As of April 29, 2025
Unaudited ($ in thousands, except per-share amounts)
Plymouth affirmed its full year 2025 guidance range for Core FFO per weighted average common share and units previously issued on February 26, 2025 and updated its range for net income per weighted average common share and units and accompanying assumptions.
| Full Year 2025 Range1 | |||
| Low | High | ||
| Core FFO attributable to common stockholders and unit holders per share | $ 1.85 | $ 1.89 | |
| Same Store Portfolio NOI growth - cash basis2 | 6.0% | 6.5% | |
| Average Same Store Portfolio occupancy - full year | 95.0% | 97.0% | |
| Acquisition Volume | $270,000 | $450,000 | |
| General and administrative expenses3 | $16,450 | $15,850 | |
| Interest expense, net | $32,000 | $36,500 | |
| Weighted average common shares and units outstanding4 | 46,051 | 46,051 | |
| Reconciliation of net loss attributable to common stockholders and unit holders per share to Core FFO guidance: | |||
| Full Year 2025 Range1 | |||
| Low | High | ||
| Net income/(loss) | ($0.26) | ($0.26) | |
| Depreciation and amortization | $1.87 | $1.91 | |
| Gain on sale of real estate | ($0.01) | ($0.01) | |
| Gain on financing transaction | ($0.31) | ($0.31) | |
| Series C Preferred dividend5 | ($0.17) | ($0.17) | |
| Proportionate share of Core FFO from unconsolidated joint ventures6 | $0.73 | $0.73 | |
| $1.85 | $1.89 | ||
| 1 | Our 2025 guidance refers to the Company's in-place portfolio as of April 29, 2025 and includes prospective acquisition volumes as outlined above. Our 2025 guidance does not include the impact of any prospective dispositions or capitalization activities. |
| 2 | The Same Store Portfolio consists of 168 buildings aggregating 26,107,300 rentable square feet, representing approximately 87.0% of the total in-place portfolio square footage as of April 29, 2025. The Same Store projected performance reflects an annual NOI on a cash basis, excluding termination income. The Same Store Portfolio is a subset of the consolidated portfolio and includes properties that are wholly owned by the Company as of December 31, 2023. |
| 3 | Includes non-cash stock compensation of $5.2 million for 2025. |
| 4 | As of April 29, 2025, the Company has 46,038,197 common shares and units outstanding. |
| 5 | Series C Preferred dividend includes cash and accrued (PIK) dividends at an annualized rate of 7.0%. |
| 6 | Proportionate share of Core FFO adjustments from unconsolidated joint ventures reverses out the loss in investment of unconsolidated joint ventures recognized within the Statements of Operations and adds back the Company's proportionate share of Core FFO from the unconsolidated joint venture. |
Q1 2025 Supplemental | 9
 |
Financial
|
Q1 2025 Supplemental | 10
![]()
Consolidated Balance Sheets
Unaudited ($ in thousands)
| March 31, 2025 | December 31, 2024 | September 30, 2024 | June 30, 2024 | March 31, 2024 | ||||||||||||||||
| ASSETS | ||||||||||||||||||||
| Real estate properties: | ||||||||||||||||||||
| Land | $ | 187,732 | $ | 181,357 | $ | 237,514 | $ | 223,049 | $ | 224,532 | ||||||||||
| Building and improvements | 1,293,061 | 1,236,948 | 1,156,378 | 1,325,468 | 1,326,722 | |||||||||||||||
| Net investment in sales-type lease1 | — | — | — | 21,396 | 21,459 | |||||||||||||||
| Less: accumulated depreciation | (276,600 | ) | (261,608 | ) | (246,652 | ) | (292,454 | ) | (277,253 | ) | ||||||||||
| Total real estate properties, net | $ | 1,204,193 | $ | 1,156,697 | $ | 1,147,240 | $ | 1,277,459 | $ | 1,295,460 | ||||||||||
| Real estate assets held for sale, net 1 | — | — | 199,548 | — | — | |||||||||||||||
| Cash, cash held in escrow and restricted cash | 43,522 | 43,627 | 33,556 | 36,129 | 27,237 | |||||||||||||||
| Investment of unconsolidated joint ventures1 | 54,329 | 62,377 | — | — | — | |||||||||||||||
| Deferred lease intangibles, net | 44,711 | 41,677 | 44,458 | 42,434 | 46,396 | |||||||||||||||
| Interest rate swaps1 | 13,157 | 17,760 | 13,237 | 25,328 | 26,382 | |||||||||||||||
| Other assets | 41,167 | 42,622 | 49,256 | 40,445 | 39,670 | |||||||||||||||
| Forward contract asset 1 | 5,185 | 3,658 | 9,116 | — | — | |||||||||||||||
| Total assets | $ | 1,406,264 | $ | 1,368,418 | $ | 1,496,411 | $ | 1,421,795 | $ | 1,435,145 | ||||||||||
| LIABILITIES, REDEEMABLE NON-CONTROLLING INTEREST AND EQUITY | ||||||||||||||||||||
| Secured debt, net | $ | 175,236 | $ | 175,980 | $ | 176,717 | $ | 262,834 | $ | 265,619 | ||||||||||
| Unsecured debt, net1 | 532,435 | 467,741 | 644,865 | 603,726 | 603,558 | |||||||||||||||
| Interest rate swaps1 | 389 | 520 | 1,085 | 5 | 189 | |||||||||||||||
| Accounts payable, accrued expenses and other liabilities | 78,739 | 83,827 | 83,397 | 67,492 | 68,049 | |||||||||||||||
| Real estate liabilities held for sale, net 1 | — | — | 67,982 | — | — | |||||||||||||||
| Warrant liability1 | 33,090 | 45,908 | 73,335 | — | — | |||||||||||||||
| Deferred lease intangibles, net | 5,133 | 5,026 | 5,095 | 5,134 | 5,590 | |||||||||||||||
| Financing lease liability1 | 2,299 | 2,297 | 2,290 | 2,284 | 2,278 | |||||||||||||||
| Total liabilities | $ | 827,321 | $ | 781,299 | $ | 1,054,766 | $ | 941,475 | $ | 945,283 | ||||||||||
| Redeemable non-controlling interest - Series C Preferred Units 1 | $ | 1,737 | $ | 1,259 | $ | 426 | $ | — | $ | — | ||||||||||
| Equity: | ||||||||||||||||||||
| Common stock | $ | 456 | $ | 454 | $ | 454 | $ | 454 | $ | 453 | ||||||||||
| Additional paid in capital | 594,989 | 604,839 | 614,716 | 624,810 | 634,651 | |||||||||||||||
| Accumulated deficit | (37,412 | ) | (43,262 | ) | (190,675 | ) | (175,074 | ) | (176,388 | ) | ||||||||||
| Accumulated other comprehensive income | 12,964 | 17,517 | 11,969 | 24,998 | 25,859 | |||||||||||||||
| Total stockholders' equity | $ | 570,997 | $ | 579,548 | $ | 436,464 | $ | 475,188 | $ | 484,575 | ||||||||||
| Non-controlling interest | 6,209 | 6,312 | 4,755 | 5,132 | 5,287 | |||||||||||||||
| Total equity | $ | 577,206 | $ | 585,860 | $ | 441,219 | $ | 480,320 | $ | 489,862 | ||||||||||
| Total liabilities, redeemable non-controlling interest and equity | $ | 1,406,264 | $ | 1,368,418 | $ | 1,496,411 | $ | 1,421,795 | $ | 1,435,145 | ||||||||||
| 1 | See Glossary, page 33 for further information. |
Q1 2025 Supplemental | 11
![]()
Consolidated Statements of Operations
Unaudited ($ in thousands, except per-share amounts)
| For the Three Months Ended, | ||||||||||||||||||||
| March 31, 2025 | December 31, 2024 | September 30, 2024 | June 30, 2024 | March 31, 2024 | ||||||||||||||||
| Revenues: | ||||||||||||||||||||
| Rental revenue | $ | 34,313 | $ | 35,732 | $ | 38,328 | $ | 36,890 | $ | 37,331 | ||||||||||
| Tenant recoveries | 11,105 | 11,560 | 13,104 | 11,759 | 12,859 | |||||||||||||||
| Management fee revenue and other income | 153 | 278 | 439 | 37 | 38 | |||||||||||||||
| Total revenues | $ | 45,571 | $ | 47,570 | $ | 51,871 | $ | 48,686 | $ | 50,228 | ||||||||||
| Operating expenses: | ||||||||||||||||||||
| Property | 14,709 | 14,133 | 17,374 | 13,569 | 16,642 | |||||||||||||||
| Depreciation and amortization | 19,352 | 21,004 | 21,010 | 21,347 | 22,368 | |||||||||||||||
| General and administrative | 4,123 | 3,938 | 3,582 | 3,880 | 3,364 | |||||||||||||||
| Total operating expenses | $ | 38,184 | $ | 39,075 | $ | 41,966 | $ | 38,796 | $ | 42,374 | ||||||||||
| Other income (expense): | ||||||||||||||||||||
| Interest expense | (6,849 | ) | (8,044 | ) | (10,359 | ) | (9,411 | ) | (9,598 | ) | ||||||||||
| Loss in investment of unconsolidated joint ventures1 | (8,048 | ) | (5,145 | ) | — | — | — | |||||||||||||
| Loss on extinguishment of debt | — | (269 | ) | — | — | — | ||||||||||||||
| Gain (loss) on sale of real estate1 | 301 | 136,751 | (234 | ) | 849 | 8,030 | ||||||||||||||
| Gain (loss) on financing transaction1 | 14,085 | 21,317 | (14,657 | ) | — | — | ||||||||||||||
| Loss on interest rate swap1 | — | (481 | ) | — | — | — | ||||||||||||||
| Unrealized gain (loss) from interest rate swap1 | 131 | (39 | ) | — | — | — | ||||||||||||||
| Total other income (expense) | $ | (380 | ) | $ | 144,090 | $ | (25,250 | ) | $ | (8,562 | ) | $ | (1,568 | ) | ||||||
| Income before income tax provision | $ | 7,007 | $ | 152,585 | $ | (15,345 | ) | $ | 1,328 | $ | 6,286 | |||||||||
| Income tax provision1 | — | (2,487 | ) | — | — | — | ||||||||||||||
| Net income (loss) | $ | 7,007 | $ | 150,098 | $ | (15,345 | ) | $ | 1,328 | $ | 6,286 | |||||||||
| Less: Net income (loss) attributable to non-controlling interest | 70 | 1,608 | (170 | ) | 14 | 68 | ||||||||||||||
| Less: Net income attributable to redeemable non-controlling interest - Series C Preferred Units | 1,087 | 1,077 | 426 | — | — | |||||||||||||||
| Net income (loss) attributable to Plymouth Industrial REIT, Inc. | $ | 5,850 | $ | 147,413 | $ | (15,601 | ) | $ | 1,314 | $ | 6,218 | |||||||||
| Less: Amount allocated to participating securities | 95 | 1,201 | 89 | 94 | 94 | |||||||||||||||
| Net income (loss) attributable to common stockholders | $ | 5,755 | $ | 146,212 | $ | (15,690 | ) | $ | 1,220 | $ | 6,124 | |||||||||
| Net income (loss) per share attributable to common stockholders – basic1 | $ | 0.13 | $ | 3.25 | $ | (0.35 | ) | $ | 0.03 | $ | 0.14 | |||||||||
| Net income (loss) per share attributable to common stockholders – diluted1 | $ | 0.13 | $ | 3.24 | $ | (0.35 | ) | $ | 0.03 | $ | 0.14 | |||||||||
| Weighted-average common shares outstanding - basic | 45,087 | 45,020 | 45,009 | 44,991 | 44,937 | |||||||||||||||
| Weighted-average common shares outstanding - diluted | 45,096 | 45,099 | 45,009 | 45,028 | 44,971 | |||||||||||||||
| 1 | See Glossary, page 35 for further information. |
Q1 2025 Supplemental | 12
![]()
Non-GAAP Measurements
Unaudited ($ and shares in thousands, except per-share amounts)
| For the Three Months Ended, | ||||||||||||||||||||
| March 31, 2025 | December 31, 2024 | September 30, 2024 | June 30, 2024 | March 31, 2024 | ||||||||||||||||
| Consolidated NOI | ||||||||||||||||||||
| Net income (loss) | $ | 7,007 | $ | 150,098 | $ | (15,345 | ) | $ | 1,328 | $ | 6,286 | |||||||||
| Income tax provision | — | 2,487 | — | — | — | |||||||||||||||
| General and administrative | 4,123 | 3,938 | 3,582 | 3,880 | 3,364 | |||||||||||||||
| Depreciation and amortization | 19,352 | 21,004 | 21,010 | 21,347 | 22,368 | |||||||||||||||
| Interest expense | 6,849 | 8,044 | 10,359 | 9,411 | 9,598 | |||||||||||||||
| Loss in investment of unconsolidated joint ventures | 8,048 | 5,145 | — | — | — | |||||||||||||||
| Loss on extinguishment of debt | — | 269 | — | — | — | |||||||||||||||
| (Gain) loss on sale of real estate1 | (301 | ) | (136,751 | ) | 234 | (849 | ) | (8,030 | ) | |||||||||||
| (Gain) loss on financing transaction1 | (14,085 | ) | (21,317 | ) | 14,657 | — | — | |||||||||||||
| Loss on interest rate swap | — | 481 | — | — | — | |||||||||||||||
| Unrealized (gain) loss from interest rate swap | (131 | ) | 39 | — | — | — | ||||||||||||||
| Management fee revenue and other income | (153 | ) | (278 | ) | (439 | ) | (37 | ) | (38 | ) | ||||||||||
| Net Operating Income | $ | 30,709 | $ | 33,159 | $ | 34,058 | $ | 35,080 | $ | 33,548 | ||||||||||
| Earnings Before Interest, Taxes, Depreciation and Amortization for Real Estate (EBITDAre) | ||||||||||||||||||||
| Net income (loss) | $ | 7,007 | $ | 150,098 | $ | (15,345 | ) | $ | 1,328 | $ | 6,286 | |||||||||
| Income tax provision | — | 2,487 | — | — | — | |||||||||||||||
| Depreciation and amortization | 19,352 | 21,004 | 21,010 | 21,347 | 22,368 | |||||||||||||||
| Interest expense | 6,849 | 8,044 | 10,359 | 9,411 | 9,598 | |||||||||||||||
| Loss on extinguishment of debt | — | 269 | — | — | — | |||||||||||||||
| (Gain) loss on sale of real estate1 | (301 | ) | (136,751 | ) | 234 | (849 | ) | (8,030 | ) | |||||||||||
| (Gain) loss on financing transaction1 | (14,085 | ) | (21,317 | ) | 14,657 | — | — | |||||||||||||
| Loss on interest rate swap1 | — | 481 | — | — | — | |||||||||||||||
| Proportionate share of EBITDAre from unconsolidated joint ventures | 10,283 | 6,309 | — | — | — | |||||||||||||||
| Unrealized (gain) loss from interest rate swap | (131 | ) | 39 | — | — | — | ||||||||||||||
| EBITDAre | $ | 28,974 | $ | 30,663 | $ | 30,915 | $ | 31,237 | $ | 30,222 | ||||||||||
| Stock compensation | 1,134 | 1,079 | 1,093 | 1,111 | 914 | |||||||||||||||
| Pro forma effect of acquisitions/developments/dispositions2 | 854 | (1,311 | ) | 488 | 221 | 216 | ||||||||||||||
| Adjusted EBITDA | $ | 30,962 | $ | 30,431 | $ | 32,496 | $ | 32,569 | $ | 31,352 | ||||||||||
| 1 | See Glossary, page 35 for further information. |
| 2 | Includes a ($1,686) reduction related to the disposition of the Chicago portfolio completed during the period ended December 31, 2024. |
Q1 2025 Supplemental | 13
![]()
Non-GAAP Measurements (Continued)
Unaudited ($ and shares in thousands, except per-share amounts)
| For the Three Months Ended, | ||||||||||||||||||||
| March 31, 2025 | December 31, 2024 | September 30, 2024 | June 30, 2024 | March 31, 2024 | ||||||||||||||||
| Funds from Operations (FFO), Core FFO & Adjusted Funds from Operations (AFFO) | ||||||||||||||||||||
| Net income (loss) | $ | 7,007 | $ | 150,098 | $ | (15,345 | ) | $ | 1,328 | $ | 6,286 | |||||||||
| (Gain) loss on sale of real estate1 | (301 | ) | (136,751 | ) | 234 | (849 | ) | (8,030 | ) | |||||||||||
| Depreciation and amortization | 19,352 | 21,004 | 21,010 | 21,347 | 22,368 | |||||||||||||||
| Proportionate share of adjustments from unconsolidated joint ventures | 9,394 | 5,826 | — | — | — | |||||||||||||||
| FFO | $ | 35,452 | $ | 40,177 | $ | 5,899 | $ | 21,826 | $ | 20,624 | ||||||||||
| Redeemable non-controlling interest - Series C Preferred Unit dividends1 | (1,087 | ) | (1,077 | ) | (426 | ) | — | — | ||||||||||||
| (Gain) loss on financing transaction1 | (14,085 | ) | (21,317 | ) | 14,657 | — | — | |||||||||||||
| Loss on extinguishment of debt | — | 269 | — | — | — | |||||||||||||||
| Loss on hedge transaction | — | 481 | — | — | — | |||||||||||||||
| Income tax provision | — | 2,487 | — | — | — | |||||||||||||||
| Unrealized (gain) loss from interest rate swap | (131 | ) | 39 | — | — | — | ||||||||||||||
| Core FFO | $ | 20,149 | $ | 21,059 | $ | 20,130 | $ | 21,826 | $ | 20,624 | ||||||||||
| Amortization of debt related costs | 599 | 563 | 470 | 438 | 438 | |||||||||||||||
| Non-cash interest expense | 157 | (1,319 | ) | 89 | (316 | ) | (102 | ) | ||||||||||||
| Stock compensation | 1,134 | 1,079 | 1,093 | 1,111 | 914 | |||||||||||||||
| Capitalized interest | (34 | ) | (73 | ) | (140 | ) | (106 | ) | (75 | ) | ||||||||||
| Straight line rent | (208 | ) | (251 | ) | (17 | ) | 1,044 | (15 | ) | |||||||||||
| Above/below market lease rents | (292 | ) | (294 | ) | (299 | ) | (293 | ) | (318 | ) | ||||||||||
| Proportionate share of AFFO from unconsolidated joint ventures | (775 | ) | (189 | ) | — | — | — | |||||||||||||
| Recurring capital expenditures1 | (1,817 | ) | (2,024 | ) | (2,853 | ) | (1,407 | ) | (994 | ) | ||||||||||
| AFFO | $ | 18,913 | $ | 18,551 | $ | 18,473 | $ | 22,297 | $ | 20,472 | ||||||||||
| Weighted-average common shares and units outstanding1 | 45,962 | 45,880 | 45,883 | 45,873 | 45,809 | |||||||||||||||
| Core FFO attributable to common stockholders and unit holders per share | $ | 0.44 | $ | 0.46 | $ | 0.44 | $ | 0.48 | $ | 0.45 | ||||||||||
| AFFO attributable to common stockholders and unit holders per share | $ | 0.41 | $ | 0.40 | $ | 0.40 | $ | 0.49 | $ | 0.45 | ||||||||||
| 1 | See Glossary, page 35 for further information. |
Q1 2025 Supplemental | 14
![]()
Same Store Net Operating Income (NOI)
Unaudited ($ and SF in thousands)
| Same Store Portfolio Statistics | ||
| Square footage | 26,107 | Includes: Wholly-owned properties as of December 31, 2023; determined and set once per year for the following twelve months (refer to Glossary for Same Store definition)
Excludes: Chicago Joint Venture consisting of 34 properties (5,957,335 square feet), wholly-owned properties classified as repositioning, lease-up during 2024 or 2025 (7 buildings representing approximately 1,211,000 of rentable square feet), placed into service 2024 and 2025, and under contract for sale |
| Number of properties | 115 | |
| Number of buildings | 168 | |
| Percentage of total portfolio square footage | 87.0% | |
| Occupancy at period end | 94.7% | |
| Same Store NOI | |||||
| March 31, 2025 | December 31, 2024 | September 30, 2024 | June 30, 2024 | March 31, 2024 | |
| Same Store NOI - GAAP Basis | |||||
| Rental revenue | $ 39,784 | $ 37,820 | $ 38,105 | $ 38,219 | $ 38,422 |
| Property expenses | 12,477 | 10,913 | 11,995 | 11,307 | 11,425 |
| Same Store NOI - GAAP Basis | $ 27,307 | $ 26,907 | $ 26,110 | $ 26,912 | $ 26,997 |
| Early termination revenue | 23 | - | - | 150 | 23 |
| Same Store NOI - GAAP Basis excluding early termination revenue | $ 27,284 | $ 26,907 | $ 26,110 | $ 26,762 | $ 26,974 |
| Same Store NOI - Cash Basis | |||||
| Same Store Adjustments: | |||||
| Straight line rent and above (below) market lease | 231 | 330 | 271 | (631) | 451 |
| Same Store NOI - Cash Basis | $ 27,076 | $ 26,577 | $ 25,839 | $ 27,543 | $ 26,546 |
| Early termination revenue | 23 | - | - | 150 | 23 |
| Same Store NOI - Cash Basis excluding early termination revenue | $ 27,053 | $ 26,577 | $ 25,839 | $ 27,393 | $ 26,523 |
| Same store occupancy at period end | 94.7% | 92.2% | 94.2% | 97.6% | 97.6% |
| Percentage of total portfolio square footage1 | 87.0% | 88.0% | 74.8% | 77.2% | 76.7% |
| Same Store NOI - GAAP Basis percent change2 | 1.1% | ||||
| Same Store NOI - Cash Basis percent change2 | 2.0% | ||||
| 1 | On November 13, 2024, 34 properties located in and around the Chicago market were contributed to the Chicago Joint Venture for a purchase price of $356.6 million. The 5.9 million square feet related to these properties is included in the total portfolio square footage for the periods ended March 31, 2024, June 30, 2024 and September 30, 2024. |
| 2 | Represents the year-over-year change between the three months ended March 31, 2025 and three months ended March 31, 2024. |
Q1 2025 Supplemental | 15
![]()
Debt Summary
As of March 31, 2025
Unaudited ($ in thousands)
| Maturity Date | Interest Rate | Commitment | Principal Balance | ||
| Unsecured Debt: | |||||
| $200m KeyBank Term Loan | February-27 | 2.93%1,2 | $ 200,000 | $ 200,000 | |
| $150m KeyBank Term Loan | May-27 | 4.30%1,2 | 150,000 | 150,000 | |
| $100m KeyBank Term Loan | November-28 | 2.90%1,2 | 100,000 | 100,000 | |
| KeyBank Line of Credit | November-28 | 5.77%1,2 | 500,000 | 84,500 | |
| Total / Weighted Average Unsecured Debt | 3.76% | $ 950,000 | $ 534,500 | ||
| Market | Maturity Date | Interest Rate | # of Buildings | Principal Balance | |
| Secured Debt: | |||||
| Allianz Loan | Jacksonville | April-26 | 4.07% | 23 | $ 59,784 |
| Nationwide Loan | St. Louis | October-27 | 2.97% | 2 | 14,551 |
| Lincoln Life Gateway Mortgage3 | St. Louis | January-28 | 3.43% | 2 | 28,800 |
| Minnesota Life Memphis Industrial Loan3 | Memphis | January-28 | 3.15% | 28 | 53,483 |
| Minnesota Life Loan | Multiple | May-28 | 3.78% | 7 | 18,982 |
| Total / Weighted Average Secured Debt | 3.56% | 62 | $ 175,600 | ||
| Total / Weighted Average Debt | 3.71% | $ 710,100 |
| 1 | For the month of March 2025, the one-month term SOFR for our unsecured debt at a weighted average of 4.322% and the one-month term SOFR for our borrowings under line of credit was at a weighted average of 4.323%. The spread over the applicable rate for the $100m, $150m, and $200m KeyBank Term Loans and KeyBank unsecured line of credit is based on the Company’s total leverage ratio plus the 0.1% SOFR index adjustment. |
| 2 | The one-month term SOFR for the $100m, $150m and $200m KeyBank Term Loans was swapped to a fixed rate of 1.504%, 2.904%, and 1.527%, respectively. |
| 3 | Debt assumed at acquisition. |
Q1 2025 Supplemental | 16
![]()
Capitalization
As of March 31, 2025
Unaudited ($ in thousands, except per-share amounts)
| March 31, 2025 | December 31, 2024 | September 30, 2024 | June 30, 2024 | March 31, 2024 | ||||||||||||||||
| Net Debt: | ||||||||||||||||||||
| Total Debt1 | $ | 771,124 | $ | 705,790 | $ | 890,998 | $ | 869,235 | $ | 872,059 | ||||||||||
| Less: Cash | 43,522 | 43,627 | 33,556 | 36,129 | 27,237 | |||||||||||||||
| Net Debt | $ | 727,602 | $ | 662,163 | $ | 857,442 | $ | 833,106 | $ | 844,822 | ||||||||||
| Common Shares and Units Outstanding2 | 46,038 | 45,879 | 45,881 | 45,887 | 45,872 | |||||||||||||||
| Closing Price (as of period end) | $ | 16.30 | $ | 17.80 | $ | 22.60 | $ | 21.38 | $ | 22.50 | ||||||||||
| Market Value of Common Shares3 | $ | 750,419 | $ | 816,646 | $ | 1,036,911 | $ | 981,064 | $ | 1,032,120 | ||||||||||
| Preferred Units - Series C (outstanding borrowing + unpaid dividends)4 | 62,647 | 62,169 | 61,336 | — | — | |||||||||||||||
| Total Market Capitalization3,5 | $ | 1,584,190 | $ | 1,584,605 | $ | 1,989,245 | $ | 1,850,299 | $ | 1,904,179 | ||||||||||
| Dividend / Share (annualized) | $ | 0.96 | $ | 0.96 | $ | 0.96 | $ | 0.96 | $ | 0.96 | ||||||||||
| Dividend Yield (annualized) | 5.9% | 5.4% | 4.2% | 4.5% | 4.3% | |||||||||||||||
| Total Debt-to-Total Market Capitalization | 48.7% | 44.5% | 44.8% | 47.0% | 45.8% | |||||||||||||||
| Secured Debt as a % of Total Debt | 24.7% | 27.3% | 27.5% | 30.4% | 30.6% | |||||||||||||||
| Unsecured Debt as a % of Total Debt | 75.3% | 72.7% | 72.5% | 69.6% | 69.4% | |||||||||||||||
| Net Debt-to-Annualized Adjusted EBITDA (quarter annualized)6 | 5.9 | x | 5.4 | x | 6.6 | x | 6.4 | x | 6.7 | x | ||||||||||
| Net Debt plus Preferred-to-Annualized Adjusted EBITDA (quarter annualized)6 | 6.4 | x | 6.0 | x | 7.1 | x | 6.4 | x | 6.7 | x | ||||||||||
| Weighted Average Maturity of Total Debt (years) | 2.4 | 2.6 | 2.2 | 2.7 | 2.7 | |||||||||||||||
| 1 | Total Debt is not adjusted for the amortization of debt issuance costs or fair market premiums or discounts. Total Debt includes the Company's pro rata share of unconsolidated joint venture debt in the amount of $61.0 million. |
| 2 | Common shares and units outstanding include 490 units outstanding at the end of each quarter presented. |
| 3 | Based on closing price as of last trading day of the quarter and common shares and units outstanding as of the period ended. |
| 4 | As of March 31, 2025, our outstanding principal amount associated with drawn principal is $60,910 plus unpaid cash and PIK dividends of $1,737. |
| 5 | Market value of shares and units plus total debt and preferred units as of period end. |
| 6 | Adjusted EBITDA includes an adjustment for the proportionate share of Adjusted EBITDA from unconsolidated joint ventures. |
Q1 2025 Supplemental | 17
![]()
Net Asset Value Components
As of March 31, 2025
Unaudited ($ in thousands)
Net Operating Income
| Three Months Ended March 31, 2025 | |
| Pro Forma Net Operating Income (NOI) | |
| Total Operating NOI | $ 30,709 |
| Proportionate share of NOI from unconsolidated joint ventures | 2,291 |
| Pro Forma Effect of New Lease Activity1 | 790 |
| Pro Forma Effect of Acquisitions / Dispositions2 | 756 |
| Pro Forma Effect of Repositioning / Development3 | 653 |
| Pro Forma NOI | $ 35,199 |
| Amortization of above / below market lease intangibles, net | (587) |
| Straight-line rental revenue adjustment | (400) |
| Pro Forma Cash NOI | $ 34,212 |
Developable Land
Market |
Owned Land (acres)4 | Developable GLA (SF)4 |
Under Construction (SF)5 |
Est. Investment / Est. Completion |
Under Development (SF)5 |
| Atlanta | 9 | 200,000 | |||
| Chicago | 11 | 220,000 | |||
| Cincinnati | 18 | 285,308 | 285,308 | ||
| Jacksonville | 12 | 41,958 | 41,958 | $5.7M/Q4'25 | |
| Memphis | 30 | 475,000 | 106,000 | ||
| St. Louis | 31 | 300,000 | |||
| Charlotte | 6 | 100,000 | |||
| 117 | 1,622,266 | 41,958 | 391,308 |
Other Assets and Liabilities
| As of March 31, 2025 | |
| Cash, cash held in escrow and restricted cash | $ 43,522 |
| Other assets | $ 41,167 |
| Construction in progress | $ 7,930 |
| Accounts payable, accrued expenses and other liabilities | $ 78,739 |
| Proportionate share of assets from unconsolidated joint ventures | $ 129,776 |
Debt, Common Stock and Preferred Units
| As of March 31, 2025 | |
| Secured Debt | $ 175,600 |
| Proportionate share of Secured Debt from unconsolidated joint ventures | $ 61,688 |
| Unsecured Debt | $ 534,500 |
| Preferred Units - Series C | $ 62,647 |
| Common shares and units outstanding7 | 46,038 |
Note: We have made a number of assumptions with respect to the pro forma effects and there can be no assurance that we would have generated the projected levels of NOI had we actually owned the acquired properties and / or fully stabilized the repositioning / development properties as of the beginning of the period. Refer to Glossary in this Supplemental Information for a definition and discussion of non-GAAP financial measures.
| 1 | Represents the estimated incremental base rents from uncommenced new leases as if rent commencement had occurred as of the beginning of the period. |
| 2 | Represents the estimated impact of acquisitions and dispositions as if they had been acquired at the beginning of the period. |
| 3 | Represents the estimated impact of properties that are undergoing repositioning or lease-up and development properties placed in-service as if the properties were stabilized and rents had commenced as of the beginning of the period. |
| 4 | Developable land represents acreage currently owned by us and identified for potential development. The developable gross leasable area (GLA) is based on the developable land area and a land to building ratio. Developable land and GLA are estimated and can change periodically due to changes in site design, road and storm water requirements, parking requirements and other factors. We have made a number of assumptions in such estimates and there can be no assurance that we will develop land that we own. |
| 5 | Under construction represents projects for which vertical construction has commenced. Under development represents projects in the pre-construction phase. |
| 6 | The Company’s 35% share of NOI from the Chicago joint venture. |
| 7 | Common shares and units outstanding were 45,547,898 and 490,229 as of March 31, 2025 respectively. |
Q1 2025 Supplemental | 18
![]()
Chicago Joint Venture
As of March 31, 2025
Unaudited ($ in thousands)
On November 13, 2024, the Company contributed 34 of its Chicago-area properties to a joint venture with Sixth Street Partners, LLC at a 6.2% capitalization rate for a total purchase price of approximately $356.6 million. The Company will retain a 35% ownership in the joint venture.
| Unconsolidated Joint Venture Portfolio Statistics | Sixth Street Joint Venture | ||||
| Number of Buildings | 34 | Joint Venture Member | Initial Partnership Interests | Total Equity Commitment | |
| Square Footage | 5,957,335 | Plymouth (Managing Member) | 35% | $ 60,921 | |
| Portfolio Occupancy | 92.4% | Sixth Street | 65% | 113,140 | |
| WA Lease Term Remaining (yrs.)1 | 3.7 | $ 174,061 | |||
| Multi-Tenant as % of ABR | 56.7% | ||||
| Single Tenant as % of ABR | 43.3% | ||||
| WA Annual Rent Escalators | 3.0% | ||||
| Triple Net Leases as % of ABR | 73.9% | ||||
| ABR | $ 25,568 | ||||
| Replacement Cost | $ 681,298 | ||||
| Balance Sheet Information | Selected Quarter-to-date Information | ||||
| ASSETS | Joint Venture | Plymouth (35%) | |||
| Real estate properties: | Revenues | $ 10,745 | $ 3,761 | ||
| Total real estate properties, net | $ 333,077 | Net Operating Income | 6,545 | 2,291 | |
| Other assets | 37,712 | Interest Expense | 2,538 | 888 | |
| Total assets | $ 370,789 | EBITDA | 6,385 | 2,235 | |
| LIABILITIES AND EQUITY | FFO | 3,847 | 1,346 | ||
| Secured debt, net | $ 174,353 | ||||
| Other liabilities | 30,021 | ||||
| Total liabilities | $ 204,374 | ||||
| Joint Venture Key Terms | |||||
| Sixth Street to receive distributions sufficient to receive a 13.5% IRR | |||||
| Plymouth to receive distributions sufficient to receive a 13.5% IRR | |||||
| Thereafter, (i) 70% to Plymouth and (ii) 30% to Sixth Street | |||||
| Plymouth to receive an asset management fee equal to 1% of annual gross cash receipts | |||||
| 1 | The average contractual lease term remaining as of the close of the reporting period (in years) weighted by square footage. |
Q1 2025 Supplemental | 19
![]()
Rentable Square Feet and Annualized Base Rent by Market
As of March 31, 2025
Unaudited ($ in thousands)
| # of Properties |
# of Buildings |
Occupancy |
Total Rentable Square Feet |
% Rentable Square Feet |
ABR2 | % ABR |
Market Inventory (SF in millions) | |
| Primary Markets1 | ||||||||
| Atlanta | 12 | 14 | 99.4% | 2,384,418 | 7.9% | $ 11,647 | 8.3% | 860 |
| Boston | 1 | 2 | 100.0% | 268,713 | 0.9% | 2,389 | 1.7% | 369 |
| Charlotte | 1 | 1 | 100.0% | 155,220 | 0.5% | 1,229 | 0.9% | 393 |
| Cincinnati | 18 | 26 | 91.7% | 3,472,704 | 11.6% | 16,604 | 11.8% | 363 |
| Cleveland | 16 | 19 | 92.4% | 3,979,209 | 13.3% | 18,223 | 13.0% | 356 |
| Columbus | 14 | 14 | 99.5% | 3,230,487 | 10.8% | 12,402 | 8.8% | 385 |
| Indianapolis | 17 | 17 | 91.8% | 4,085,169 | 13.6% | 15,018 | 10.7% | 429 |
| Memphis | 29 | 62 | 92.7% | 6,370,599 | 21.2% | 27,984 | 19.9% | 334 |
| St. Louis | 12 | 14 | 90.7% | 3,219,689 | 10.7% | 14,164 | 10.1% | 345 |
| Primary Total | 120 | 169 | 93.7% | 27,166,208 | 90.5% | $ 119,660 | 85.2% | 3,834 |
| Secondary Markets1 | ||||||||
| Jacksonville | 8 | 29 | 100.0% | 2,185,316 | 7.3% | $ 17,894 | 12.7% | 167 |
| South Bend | 5 | 6 | 100.0% | 667,000 | 2.2% | 2,946 | 2.1% | 48 |
| Secondary Total | 13 | 35 | 100.0% | 2,852,316 | 9.5% | $ 20,840 | 14.8% | 215 |
| Total Portfolio | 133 | 204 | 94.3% | 30,018,524 | 100.0% | $ 140,500 | 100.0% | 4,049 |
| Chicago (unconsolidated) | 34 | 34 | 92.4% | 5,957,335 | $ 25,568 | 1,422 |
| 1 | Inventory as defined by CoStar refers to the total square footage of buildings that have received a certificate of occupancy and are able to be occupied by tenants. It does not include space that is either planned, or under construction. Inventory square footage solely includes industrial buildings as of April 17, 2025. Our definitions of primary and secondary markets are based on this market inventory. Primary markets means metropolitan areas in the U.S, with more than 300 million square feet of inventory. While secondary markets consist of between 100 million and 300 million square feet of inventory. |
| 2 | Annualized base rent is calculated as monthly contracted base rent as of March 31, 2025, multiplied by 12. Excludes rent abatements. |
Q1 2025 Supplemental | 20
 |
Operational &
|
Q1 2025 Supplemental | 21
![]()
Leasing Activity
As of March 31, 2025
Unaudited
Lease Renewals and New Leases
Year |
Type |
Square Footage |
Percent |
Expiring Rent |
New Rent |
% Change |
Tenant Improvements1 | Lease Commissions1 |
| 2021 | Renewals | 2,487,589 | 49.3% | $ 4.25 | $ 4.50 | 5.9% | $ 0.19 | $ 0.10 |
| New Leases | 2,557,312 | 50.7% | $ 3.76 | $ 4.40 | 17.0% | $ 0.23 | $ 0.22 | |
| Total | 5,044,901 | 100.0% | $ 4.00 | $ 4.45 | 11.1% | $ 0.21 | $ 0.16 | |
| 2022 | Renewals | 4,602,355 | 60.2% | $ 4.31 | $ 4.87 | 13.1% | $ 0.15 | $ 0.16 |
| New Leases | 3,041,526 | 39.8% | $ 3.51 | $ 4.51 | 28.6% | $ 0.40 | $ 0.23 | |
| Total | 7,643,881 | 100.0% | $ 3.99 | $ 4.73 | 18.5% | $ 0.25 | $ 0.19 | |
| 2023 | Renewals | 3,945,024 | 70.4% | $ 3.75 | $ 4.36 | 16.3% | $ 0.14 | $ 0.15 |
| New Leases | 1,654,919 | 29.6% | $ 3.82 | $ 5.03 | 31.7% | $ 0.35 | $ 0.35 | |
| Total | 5,599,943 | 100.0% | $ 3.77 | $ 4.56 | 21.0% | $ 0.21 | $ 0.21 | |
| 2024 | Renewals | 4,180,593 | 71.7% | $ 4.02 | $ 4.54 | 12.9% | $ 0.15 | $ 0.13 |
| New Leases | 1,646,543 | 28.3% | $ 4.25 | $ 5.45 | 28.2% | $ 0.51 | $ 0.29 | |
| Total | 5,827,136 | 100.0% | $ 4.09 | $ 4.79 | 17.1% | $ 0.25 | $ 0.17 | |
| Q1 2025 | Renewals | 1,540,756 | 63.2% | $ 4.40 | $ 5.06 | 15.0% | $ 0.16 | $ 0.19 |
| New Leases | 896,511 | 36.8% | $ 4.61 | $ 4.65 | 0.9% | $ 0.14 | $ 0.30 | |
| Total | 2,437,267 | 100.0% | $ 4.48 | $ 4.91 | 9.6%2 | $ 0.15 | $ 0.23 |
Note: Lease renewals and new lease activity excludes leases with terms less than six months, and leases associated with construction.
1 Shown as per dollar, per square foot, per year.
2 Excluding the effect of the previously announced executed two-year lease at our 769,500-square-foot Class A building in St. Louis that commenced on January 15, 2025, rental rates under these leases reflect a 16.2% increase on a cash basis with renewal leases reflecting a 15.0% increase on a cash basis and new leases reflecting a 22.1% increase on a cash basis.
Q1 2025 Supplemental | 22
![]()
Leasing Activity (continued)
As of March 31, 2025
Unaudited
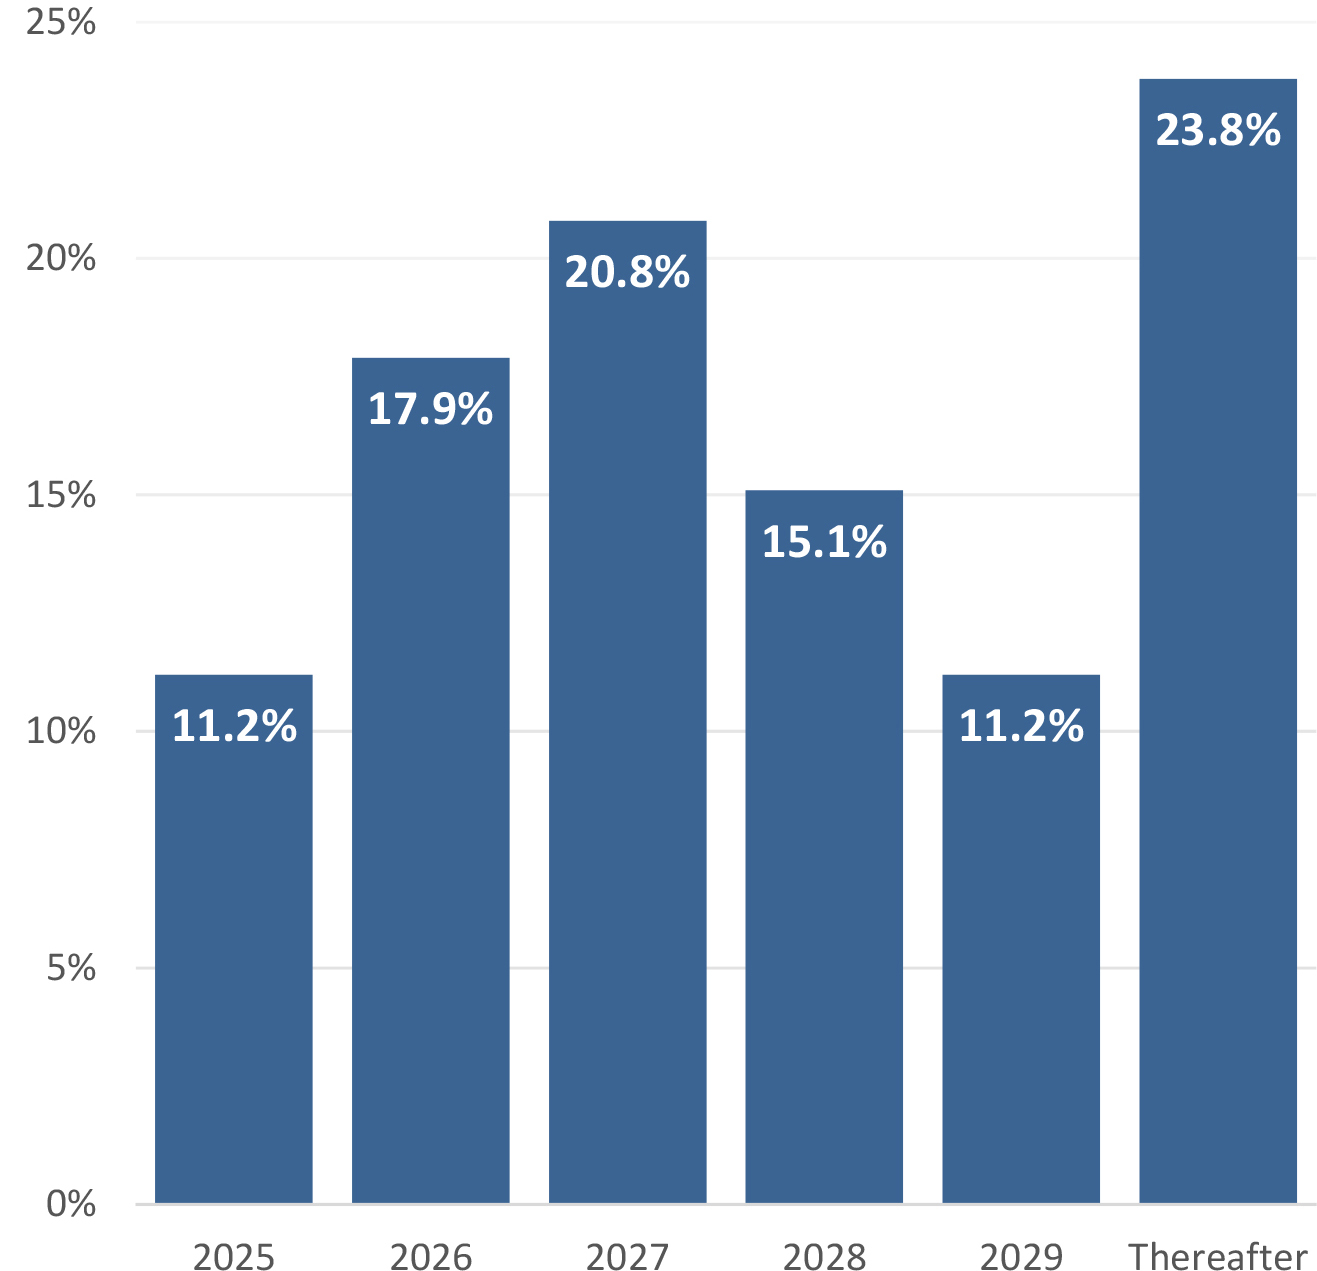
Lease Expiration Schedule (Wholly-owned portfolio
Year |
Square Footage |
ABR1 |
% of ABR Expiring2 |
| Available | 1,721,792 | - | - |
| 2025 | 3,162,823 | $ 15,756,512 | 11.2% |
| 2026 | 5,311,031 | 25,209,734 | 17.9% |
| 2027 | 5,988,067 | 29,188,226 | 20.8% |
| 2028 | 4,105,001 | 21,212,824 | 15.1% |
| 2029 | 3,383,764 | 15,743,473 | 11.2% |
| Thereafter | 6,346,046 | 33,389,564 | 23.8% |
| Total | 30,018,524 | $ 140,500,333 | 100.0% |
% of Annual Base Rent Expiring2
| 1 | Annualized base rent is calculated as monthly contracted base rent as of March 31, 2025, multiplied by 12. Excludes rent abatements. |
| 2 | Calculated as annualized base rent set forth in this table divided by total annualized base rent as of March 31, 2025. |
Q1 2025 Supplemental | 23
![]()
Leased Square Feet and Annualized Base Rent by Tenant Industry
As of March 31, 2025
Unaudited
| Industry1 | Total Leased Square Feet |
# of Leases |
% Rentable Square Feet |
ABR2 | % ABR | ABR Per Square Foot |
| Logistics & Transportation | 8,635,842 | 73 | 30.6% | $ 37,931,996 | 27.0% | $ 4.39 |
| Automotive | 2,259,936 | 25 | 8.0% | 10,800,997 | 7.7% | 4.78 |
| Wholesale/Retail | 2,018,061 | 27 | 7.1% | 10,349,834 | 7.4% | 5.13 |
| Home & Garden | 1,739,911 | 22 | 6.1% | 6,148,508 | 4.4% | 3.53 |
| Construction | 1,378,472 | 39 | 4.9% | 7,098,585 | 5.1% | 5.15 |
| Plastics | 1,566,202 | 18 | 5.5% | 7,499,388 | 5.3% | 4.79 |
| Healthcare | 1,197,123 | 47 | 4.2% | 8,172,372 | 5.8% | 6.83 |
| Printing & Paper | 1,129,059 | 12 | 4.0% | 3,949,596 | 2.8% | 3.50 |
| Food & Beverage | 934,868 | 18 | 3.3% | 5,506,747 | 3.9% | 5.89 |
| Business Services | 915,086 | 34 | 3.2% | 6,083,709 | 4.3% | 6.65 |
| Industrial Equipment Components | 862,868 | 25 | 3.0% | 4,318,501 | 3.1% | 5.00 |
| Cardboard and Packaging | 572,789 | 10 | 2.0% | 2,669,063 | 1.9% | 4.66 |
| Technology & Electronics | 530,051 | 22 | 1.9% | 3,689,995 | 2.6% | 6.96 |
| Other Industries3 | 4,556,464 | 132 | 16.2% | 26,281,042 | 18.7% | 5.77 |
| Total | 28,296,732 | 504 | 100.0% | $ 140,500,333 | 100.0% | $ 4.97 |
| 1 | Inclusive of the wholly-owned portfolio. |
| 2 | Annualized base rent is calculated as monthly contracted base rent as of March 31, 2025, multiplied by 12. Excludes rent abatements. |
| 3 | Includes over 20 tenant industries for which the total leased square feet aggregates to less than 250,000 square feet or 3% of ABR. |
Q1 2025 Supplemental | 24
![]()
Leased Square Feet and Annualized Base Rent by Type
As of March 31, 2025
Unaudited
| Leased Square Feet and Annualized Base Rent by Lease Type | ||||||
Lease Type |
Total Leased Square Feet |
# of Leases |
% Leased Square Feet |
Annualized Base Rent1 |
% ABR | ABR Per Square Foot |
| Triple Net | 23,575,368 | 415 | 83.3% | $ 116,015,954 | 82.6% | $ 4.92 |
| Modified Net | 2,287,831 | 47 | 8.1% | 11,299,247 | 8.0% | 4.94 |
| Gross | 2,433,533 | 42 | 8.6% | 13,185,132 | 9.4% | 5.42 |
| Total | 28,296,732 | 504 | 100.0% | $ 140,500,333 | 100.0% | $ 4.97 |
| Leased Square Feet and Annualized Base Rent by Tenant Type | ||||||
| Tenant Type | Total Leased Square Feet |
# of Leases |
% Leased Square Feet |
Annualized Base Rent1 |
% ABR | ABR Per Square Foot |
| Multi-Tenant | 15,270,496 | 419 | 54.0% | $ 81,560,952 | 58.1% | $ 5.34 |
| Single-Tenant | 13,026,236 | 85 | 46.0% | 58,939,381 | 41.9% | 4.52 |
| Total | 28,296,732 | 504 | 100.0% | $ 140,500,333 | 100.0% | $ 4.97 |
| Leased Square Feet and Annualized Base Rent by Building Type | ||||||
| Building Type | Total Leased Square Feet |
# of Buildings |
% Leased Square Feet |
Annualized Base Rent1 |
% ABR | ABR Per Square Foot |
| Warehouse/Distribution | 19,390,087 | 131 | 68.4% | $ 85,221,720 | 60.7% | $ 4.40 |
| Warehouse/Light Manufacturing | 5,951,729 | 26 | 21.5% | 29,959,043 | 21.3% | 5.03 |
| Small Bay Industrial2 | 2,954,916 | 47 | 10.1% | 25,319,570 | 18.0% | 8.57 |
| Total | 28,296,732 | 204 | 100.0% | $ 140,500,333 | 100.0% | $ 4.97 |
Note: Wholly-owned portfolio.
| 1 | Annualized base rent is calculated as monthly contracted base rent as of March 31, 2025, multiplied by 12. Excludes rent abatements. |
| 2 | Small bay industrial is inclusive of flex space totaling 603,134 leased square feet and annualized base rent of $7,388,484. Small bay industrial is multipurpose space; flex space includes office space that accounts for greater than 50% of the total rentable area. |
Q1 2025 Supplemental | 25
![]()
Top 10 Tenants by Annualized Base Rent
As of March 31, 2025
Unaudited
| Tenant | Market | Industry | # of Leases |
Total Leased Square Feet |
Expiration | ABR Per Square Foot |
Annualized Base Rent1 |
% Total ABR |
| Geodis Logistics`, LLC | St. Louis | Logistics & Transportation | 1 | 624,159 | 8/31/2025 | $ 4.47 | $ 2,786,967 | 2.0% |
| Thyssenkrupp Supply Chain NA, Inc. | St. Louis | Logistics & Transportation | 1 | 600,000 | 12/31/2026 | 4.50 | 2,700,000 | 1.9% |
| Royal Canin U.S.A, Inc. | St. Louis | Wholesale/Retail | 1 | 521,171 | 12/31/2026 | 5.04 | 2,626,324 | 1.9% |
| ODW Logistics, Inc. | Columbus | Logistics & Transportation | 1 | 772,450 | 6/30/2025 | 3.06 | 2,364,186 | 1.7% |
| Communications Test Design, Inc. | Memphis | Logistics & Transportation | 2 | 566,281 | 12/31/2025 | 4.15 | 2,350,066 | 1.7% |
| Archway Marketing Holdings, Inc. | South Bend | Logistics & Transportation | 3 | 503,000 | 3/31/2026 | 4.61 | 2,319,990 | 1.7% |
| ASW Supply Chain Services, LLC | Cleveland | Logistics & Transportation | 5 | 577,237 | 11/30/2027 | 3.75 | 2,162,657 | 1.5% |
| Balta US, Inc. | Jacksonville | Home & Garden | 2 | 629,084 | 10/31/2029 | 3.22 | 2,023,828 | 1.4% |
| Winston Products, LLC | Cleveland | Wholesale/Retail | 2 | 266,803 | 4/30/2032 | 7.08 | 1,888,831 | 1.3% |
| Advanced Composites, Inc. | Columbus | Automotive | 1 | 480,000 | 12/31/2031 | 3.63 | 1,744,785 | 1.2% |
| Total Largest Tenants by Annualized Rent | 18 | 5,060,185 | $ 4.19 | $ 22,967,634 | 16.3% | |||
| All Other Tenants | 486 | 23,236,547 | $ 5.13 | $ 119,277,484 | 83.7% | |||
| Total Company Portfolio | 504 | 28,296,732 | $ 4.97 | $ 140,500,333 | 100.0% |
Note: Wholly-owned portfolio.
| 1 | Annualized base rent is calculated as monthly contracted base rent as of March 31, 2025, multiplied by 12. Excludes rent abatements. |
Q1 2025 Supplemental | 26
![]()
Lease Segmentation by Size
As of March 31, 2025
Unaudited
| Square Feet | # of Leases | Total Leased Square Feet |
Total Rentable Square Feet | Total Leased % |
Total Leased % Excluding Repositioning1 |
Annualized Base Rent2 |
In-Place + Uncommenced ABR3 |
% of Total In-Place + Uncommenced ABR |
In-Place + Uncommenced ABR Per SF4 |
| < 4,999 | 69 | 210,535 | 298,968 | 70.4% | 75.3% | $ 2,061,547 | $ 2,678,991 | 1.9% | $ 12.72 |
| 5,000 - 9,999 | 90 | 644,973 | 766,165 | 84.2% | 85.6% | 5,674,795 | 5,674,795 | 4.0% | 8.80 |
| 10,000 - 24,999 | 121 | 2,030,576 | 2,121,576 | 95.7% | 95.7% | 15,410,816 | 15,410,816 | 10.9% | 7.59 |
| 25,000 - 49,999 | 76 | 2,803,031 | 3,076,740 | 91.1% | 90.6% | 17,981,913 | 17,981,913 | 12.7% | 6.42 |
| 50,000 - 99,999 | 73 | 5,055,949 | 5,428,518 | 93.1% | 94.6% | 26,205,360 | 26,205,360 | 18.6% | 5.18 |
| 100,000 - 249,999 | 50 | 7,868,724 | 8,643,613 | 91.0% | 91.0% | 35,141,715 | 35,141,716 | 24.9% | 4.47 |
| > 250,000 | 25 | 9,682,944 | 9,682,944 | 100.0% | 100.0% | 38,024,187 | 38,024,188 | 27.0% | 3.93 |
| Total/Weighted Avg. | 504 | 28,296,732 | 30,018,524 | 94.3% | 94.5% | $ 140,500,333 | $ 141,117,779 | 100% | $ 4.99 |
| 1 | Total Leased % Excluding Repositioning excludes vacant square footage being refurbished or repositioned as of March 31, 2025. |
| 2 | Annualized base rent is calculated as monthly contracted base rent as of March 31, 2025, multiplied by 12. Excludes rent abatements. |
| 3 | In-Place + Uncommenced ABR calculated as in-place current annualized base rent as of March 31, 2025 plus annualized base rent for leases signed but not commenced as of March 31, 2025. |
| 4 | In-Place + Uncommenced ABR per SF is calculated as in-place current rent annualized base rent as of March 31, 2025 plus annualized base rent for leases signed but not commenced as of March 31, 2025, divided by leased square feet plus uncommenced leased square feet. |
Q1 2025 Supplemental | 27
![]()
Capital Expenditures
Unaudited ($ in thousands)
| Wholly-owned1 | March 31, 2025 | December 31, 2024 | September 30, 2024 | June 30, 2024 | March 31, 2024 |
| Tenant improvements | $ 869 | $ 806 | $ 1,203 | $ 480 | $ 320 |
| Lease commissions | $ 948 | $ 1,218 | $ 1,650 | $ 927 | $ 674 |
| Total Recurring Capital Expenditures | $ 1,817 | $ 2,024 | $ 2,853 | $ 1,407 | $ 994 |
| Capital expenditures | $ 2,519 | $ 4,143 | $ 5,692 | $ 3,695 | $ 664 |
| Development | $ 1,384 | $ 630 | $ 2,537 | $ 2,058 | $ 2,336 |
| Total Non-recurring Capital Expenditures | $ 3,903 | $ 4,773 | $ 8,229 | $ 5,753 | $ 3,000 |
| Total Capital Expenditures | $ 5,720 | $ 6,797 | $ 11,082 | $ 7,160 | $ 3,994 |
| Unconsolidated joint venture | March 31, 2025 | December 31, 2024 | |||
| Total Recurring Capital Expenditures | $ 822 | $ 1,382 | |||
| Total Non-recurring Capital Expenditures | $ 111 | $ 593 | |||
| Total Capital Expenditures | $ 933 | $ 1,975 |
| 1 | Capital expenditures incurred after the joint venture closing are included in the unconsolidated joint venture table below. |
Q1 2025 Supplemental | 28
 |
Appendix
|
Q1 2025 Supplemental | 29
![]()
Glossary
This glossary contains additional details for sections throughout this Supplemental Information, including explanations and reconciliations of certain non-GAAP financial measures, and the reasons why we use these supplemental measures of performance and believe they provide useful information to investors. Additional detail can be found in our most recent annual report on Form 10-K and subsequent quarterly reports on Form 10-Q, as well as other documents filed with or furnished to the SEC from time to time.
Non-GAAP Financial Measures Definitions:
Net Operating Income (NOI): We consider net operating income to be an appropriate supplemental measure to net income in that it helps both investors and management understand the core operations of our properties. We define NOI as total revenue (including rental revenue and tenant recoveries) less property-level operating expenses. NOI excludes depreciation and amortization, income tax provision, general and administrative expenses, impairments, loss in investment of unconsolidated joint ventures, gain or losses on sale of real estate, interest expense, gain (loss) on financing transaction, loss on interest rate swap, unrealized gain (loss) from interest rate swap and other non-operating items.
Cash Net Operating Income (Cash NOI): We define Cash NOI as NOI excluding straight-line rent adjustments and amortization of above and below market leases.
EBITDAre and Adjusted EBITDA: We define earnings before interest, taxes, depreciation and amortization for real estate in accordance with the standards established by the National Association of Real Estate Investment Trusts (“NAREIT”). EBITDAre represents net income (loss), computed in accordance with GAAP, before interest expense, income tax provision, depreciation and amortization, (gain) loss on sale of real estate, impairments, (gain) loss on financing transaction, (gain) loss on interest rate swap, unrealized loss from interest rates swap and loss on extinguishment of debt. Our proportionate share of EBITDAre for unconsolidated joint ventures is calculated to reflect EBITDAre on the same basis. We believe that EBITDAre is helpful to investors as a supplemental measure of our operating performance as a real estate company as it is a direct measure of the actual operating results of our industrial properties.
We calculate Adjusted EBITDA by adding or subtracting from EBITDAre the following items: (i) non-cash stock compensation, (ii) the proforma impacts of acquisition, dispositions and developments and (iii) non-cash impairments on real estate lease, (iv) adjustments for unconsolidated joint ventures. We believe that EBITDAre and Adjusted EBITDA are helpful to investors as supplemental measures of our operating performance as a real estate company as they are direct measures of the actual operating results of our industrial properties. EBITDAre and Adjusted EBITDA should not be used as measures of our liquidity and may not be comparable to how other REITs calculate EBITDAre and Adjusted EBITDA.
Funds From Operations (FFO): Funds from operations, or FFO, is a non-GAAP financial measure that is widely recognized as a measure of a REIT’s operating performance, thereby, providing investors the potential to compare our operating performance with that of other REITs. We consider FFO to be an appropriate supplemental measure of our operating performance as it is based on a net income analysis of property portfolio performance that excludes non-cash items such as depreciation. The historical accounting convention used for real estate assets requires straight-line depreciation of buildings and improvements, which implies that the value of real estate assets diminishes predictably over time. Since real estate values rise and fall with market conditions, presentations of operating results for a REIT, using historical accounting for depreciation, could be less informative. In December 2018, NAREIT issued a white paper restating the definition of FFO. The purpose of the restatement was not to change the fundamental definition of FFO, but to clarify existing NAREIT guidance. The restated definition of FFO isas follows: Net Income (Loss) (calculated in accordance with GAAP), excluding:(i) Depreciation and amortization related to real estate, (ii) Gains and losses from the sale of certain real estate assets, (iii) Gain and losses from change in control, and (iv) Impairment write-downs of certain real estate assets and investments in entities when the impairment is directly attributable to decreases in the value of depreciable real estate held by the entity. We define FO, consistent with the NAREIT definition. Adjustments for unconsolidated joint ventures will be calculated to reflect FFO on the same basis. Other equity REITs may not calculate FFO as we do, and, accordingly, our FFO may not be comparable to such other REITs’ FFO. FFO should not be used as a measure of our liquidity and is not indicative of funds available for our cash needs, including our ability to pay dividends.
Q1 2025 Supplemental | 30
![]()
Glossary (continued)
Non-GAAP Financial Measures Definitions (continued):
Core Funds from Operations (Core FFO): We calculate Core FFO by adjusting FFO for items such as dividends paid or accrued to holders of redeemable non-controlling interest, (gain) loss on financing transaction, income tax provision, and certain non-cash operating expenses such as unrealized loss from interest rate swap, loss on interest rate swap, and loss on extinguishment of debt. We believe that Core FFO is a useful supplemental measure in addition to FFO by adjusting for items that are not considered by us to be part of the period-over-period operating performance of our property portfolio, thereby, providing a more meaningful and consistent comparison of our operating and financial performance during the periods presented below. As with FFO, our reported Core FFO may not be comparable to other REITs’ Core FFO, should not be used as a measure of our liquidity, and is not indicative of funds available for our cash needs, including our ability to pay dividends.
Adjusted Funds from Operations attributable to common stockholders (AFFO): Adjusted funds from operations, or AFFO, is presented in addition to Core FFO. AFFO is defined as Core FFO, excluding certain non-cash operating revenues and expenses, capitalized interest and recurring capitalized expenditures. Recurring capitalized expenditures include expenditures required to maintain and re-tenant our properties, tenant improvements and leasing commissions. AFFO further adjusts Core FFO for certain other non-cash items, including the amortization or accretion of above or below market rents included in revenues, straight line rent adjustments, non-cash equity compensation, non-cash interest expense and adjustments for unconsolidated partnerships and joint ventures. Our proportionate share of AFFO for unconsolidated joint ventures is calculated to reflect AFFO on the same basis.
We believe AFFO provides a useful supplemental measure of our operating performance because it provides a consistent comparison of our operating performance across time periods that is comparable for each type of real estate investment and is consistent with management’s analysis of the operating performance of our properties. As a result, we believe that the use of AFFO, together with the required GAAP presentations, provide a more complete understanding of our operating performance.
As with Core FFO, our reported AFFO may not be comparable to other REITs’ AFFO, should not be used as a measure of our liquidity, and is not indicative of funds available for our cash needs, including our ability to pay dividends.
Net Debt and Preferred Stock to Adjusted EBITDA: Net debt and preferred stock (inclusive of preferred stock and redeemable non-controlling interest) to Adjusted EBITDA is a non-GAAP financial measure that we believe is useful to investors as a supplemental measure in evaluating balance sheet leverage. Net debt and preferred stock is equal to the sum of total consolidated and our pro rata share of unconsolidated joint venture debt less cash, cash equivalents, and restricted cash, plus preferred stock calculated at its liquidation preference as of the end of the period.
Q1 2025 Supplemental | 31
![]()
Glossary (continued)
Other Definitions:
GAAP: U.S. generally accepted accounting principles.
Lease Type: We define our triple net leases in that the tenant is responsible for all aspects of and costs related to the property and its operation during the lease term. We define our modified net leases in that the landlord is responsible for some property related expenses during the lease term, but the cost of most of the expenses is passed through to the tenant. We define our gross leases in that the landlord is responsible for all aspects of and costs related to the property and its operation during the lease term.
Non-Recurring Capital Expenditures: Non-recurring capital expenditures include capital expenditures of long-lived improvements required to upgrade/replace existing systems or items that previously did not exist. Non-recurring capital expenditures also include costs associated with repositioning a property, redevelopment/development and capital improvements known at the time of acquisition.
Occupancy: We define occupancy as the percentage of total leasable square footage as the earlier of lease term commencement or revenue recognition in accordance to GAAP as of the close of the reporting period.
Recurring Capital Expenditures: Recurring capitalized expenditures includes capital expenditures required to maintain and re-tenant our buildings, tenant improvements and leasing commissions.
Replacement Cost: is based on the Marshall & Swift valuation methodology for the determination of building costs. The Marshall & Swift building cost data and analysis is widely recognized within the U.S. legal system and has been written into in law in over 30 U.S. states and recognized in the U.S. Treasury Department Internal Revenue Service Publication. Replacement cost includes land reflected at the allocated cost in accordance with Financial Accounting Standards Board ("FASB") ASC 805.
Same Store Portfolio: The Same Store Portfolio is a subset of the consolidated portfolio and includes properties that are wholly-owned by the Company as of December 31, 2023. The Same Store Portfolio is evaluated and defined on an annual basis based on the growth and size of the consolidated portfolio. The Same Store Portfolio excludes properties that are classified as repositioning, lease-up during 2024 or 2025 (7 buildings representing approximately 1,211,000 of rentable square feet), placed into service during 2024 or 2025 and under contract for sale. For 2025, the Same Store Portfolio consists of 115 properties aggregating 26.1 million rentable square feet. Properties that are being repositioned generally are defined as those properties where a significant amount of space is held vacant in order to implement capital improvements that enhance the functionality, rental cash flows, and value of that property. We define a significant amount of space at a property using both the size of the space and its proportion to the properties total square footage as a determinate. Our computation of same store NOI may not be comparable to other REITs.
Weighted Average Lease Term Remaining: The average contractual lease term remaining as of the close of the reporting period (in years) weighted by square footage.
Q1 2025 Supplemental | 32
![]()
Glossary (Financials)
Balance Sheet:
Financing lease liability: As of March 31, 2025, we have a single finance lease in which we are the sublessee for a ground lease with a remaining lease term of approximately 31 years. Refer to our most recent Quarterly Report on Form 10-Q for expanded disclosure.
Forward contract asset: Represents the FMV of the Company’s contractual obligation to draw the undrawn $79.1 million of the Series C Preferred Units (as defined herein) as of the end of the period.
Interest rate swaps: Represents the fair value of the Company's interest rate swaps. We minimize the credit risk in our derivative financial instruments by transacting with various high-quality counterparties. Our exposure to credit risk at any point is generally limited to amounts recorded as assets on the accompanying consolidated balance sheets. A summary of the Company's interest rate swaps and accounting are detailed in Note 7 of our most recent Quarterly Report on Form 10-Q.
Investment of unconsolidated joint ventures: Represents our share of earnings (losses) related to our investment in an unconsolidated joint venture. The Isosceles Venture Agreement provided for liquidation rights and distribution priorities that were different from the Company’s stated ownership percentage based on total equity contributions. As such, the Company used the hypothetical-liquidation-at-book-value (“HLBV”) method to determine its equity in the earnings of the Chicago Joint Venture. The HLBV method is commonly applied to equity investments in real estate, where cash distribution percentages vary at different points in time and are not directly linked to an investor's ownership percentage.
Net investment in sales-type lease: During the quarter ended March 31, 2024, the tenant occupying a single-tenant industrial property located in Columbus, Ohio, provided notice of its intention to exercise its option to purchase the property at a fixed price of $21,480. As a result, we reclassified the respective real estate property to net investment in sales-type lease totaling $21,480 in our consolidated balance sheets, effective as of the date of tenant notice, in the following amounts: (i) $19,605 from Real estate properties, (ii) $8,094 from Accumulated depreciation, (iii) $877 from net Deferred lease intangible assets, and (iv) $1,062 from Other assets.
Real estate assets/liabilities held for sale, net: On August 26, 2024, the Plymouth Industrial Operating Partnership, L.P ( “Operating Partnership”) entered into a Contribution Agreement with an affiliate of Sixth Street Partners, LLC (the “Investor”), in which the Operating Partnership contributed 34 wholly-owned properties located in and around Chicago (each a “Chicago Property” and collectively the “Chicago Properties”) into a joint venture with the Investor in which will be owned 35% by a wholly-owned subsidiary of the Operating Partnership and 65% by the Investor. The contribution and closing conditions of the joint venture occurred during the fourth quarter of 2024. The aggregate purchase price for the Chicago Properties is $356,641, which included the assumption by the joint venture of $56,898 of debt held by the Operating Partnership that was outstanding with Transamerica Life Insurance Company and secured by certain Chicago Properties and an additional $10,506 of debt held by the Operating Partnership outstanding with Midland National Life Insurance and secured by a single Chicago Property.
Upon execution of the Contribution Agreement, the carrying amounts of the Chicago Properties were classified as "Real estate assets held for sale, net" and the corresponding carrying amount of the secured mortgages (the Transamerica Loan and the Midland National Life Insurance Mortgage) were classified "Real estate liabilities held for sale, net" on the condensed consolidated balance sheets. Upon classifying the Chicago Properties as being held for sale, the Company ceased recognizing depreciation on the Chicago Properties.
Unsecured debt, net: Includes borrowings under line of credit and term loans. Refer to Debt Summary in this Supplemental Information for additional details.
Q1 2025 Supplemental | 33
![]()
Glossary (Financials)
Redeemable Non-controlling interest - Series C Preferred Units: On August 26, 2024, the Company, through its OP, issued 60,910 Non-Convertible Series C Preferred Units (“Series C Preferred Units”) at a price of $1,000 per Series C Preferred Unit, for gross proceeds of $60,910, to the Investor. Bundled with the issuance of the 60,910 Series C Units, the Operating Partnership also issued (i) a forward contract in which the OP will sell an addition 79,090 Series C Preferred Units at a price of $1,000 per unit for gross proceeds of $79,090 before May 23rd, 2025, and (ii) warrants that are exercisable into OP Partnership Units (see “Warrant Liability”). The gross proceeds at issuance were first allocated to the Warrants, resulting in the Company recognizing a book loss of $21 million and recording the Series C Preferred Units for a nominal amount of $0.01.
Holders are entitled to receive, on a cumulative basis, (i) distributions in the form of fully paid Series C Preferred Units known as “PIK Distributions” which will be payable at the “PIK Distribution Rate” and (ii) distributions in the form of cash known as “Cash Distributions” which will be payable at the “Cash Distribution Rate.”
The Cash Distribution Rate is a rate per annum equal to (a) 4.0% within the first 5 years after August 26, 2024 (the “Original Issue Date”), (b) 8.0% in the 6th and 7th years after the Original Issue Date, and (c) 12.0% starting from the 8th year after the Original Issue Date and each subsequent year thereafter. The PIK Distribution Rate is a rate per annum equal to (a) within the first 5 years after the Original Issue Date, 7.0% less the applicable Cash Distribution Rate, (b) in the 6th and 7th years after the Original Issue Date, the greater of: (i) 12.0% or (ii) SOFR plus 650 basis points less the applicable Cash Distribution Rate, and (c) from the 8th year after the Original Issue Date and each subsequent year thereafter, the greater of (i) 16.0% or (ii) SOFR plus 1,050 basis points, less the applicable Cash Distribution Rate. Both PIK and Cash Distributions are recognized within Net income (loss) attributable to non-controlling interest within our condensed consolidated statements of operation and are recognized as a deduction to FFO to derive Core FFO.
Warrant liability: Represents the FMV of the warrants issued by the OP on August 26, 2024, to issue and sell to the holder the right to purchase Operating Partnership Units (“OP Units”) as of the end of the respective period. As of March 31, 2025, the associated strike price and amount of units outstanding for each tranche of warrants are as follows:
| - | The first tranche is for 4,582,952 OP Units with an adjusted strike price of $24.30 per unit |
| - | The second tranche is for 3,055,302 OP Units with an adjusted strike price of $25.26 per unit |
| - | The third tranche is for 4,582,952 OP Units with an adjusted strike price of $26.22 per unit |
The warrants provide antidilution adjustments, as well as adjustments in the strike price of the warrants to an amount equal to the issuance price per common share or OP Unit if the Company or the OP issues (or otherwise sells) any shares/units of common stock, OP Units, or equity-linked securities and if the Company or the OP reprices or amends any of its existing equity-linked securities. Such adjustments include the occurrence of stock dividends, splits or combinations, the distribution of rights, options or warrants of the Company’s common stock, distribution if shares of capital stock or other property, cash dividends and distributions, tender or exchange offers made by the Company or the Parent for shares of common stock and degressive issuances.
Holders of the warrants will have the right to submit all, or any whole number of warrants that is less than all of their warrants for exercise at any time during the first 5 years after the date of issuance of the warrants. This can be extended to 7 years if the volume-weighted average price of the Common Stock for the 90 consecutive trading days ending on the 5th anniversary of the issuance date is equal to or less than the Strike Price of the warrants.
Upon the exercise of any warrant, the Company at its election will settle such exercise by paying or delivering OP Units according to either a physical or cashless settlement. In the event the Company elects to deliver OP units upon settlement, the holder can elect to exchange the OP Units into common shares of the Company on a one-to-one basis, however, the Company can elect to settle these OP Units for either cash or shares of the Company’s common stock.
Q1 2025 Supplemental | 34
![]()
Glossary (Financials)
Consolidated Statements of Operations:
Gain (loss) on sale of real estate: During Q1 2025, the Company sold a single, 33,688 square foot property located in Memphis, TN for approximately $2,385, recognizing a net gain of $301.
Gain (loss) on financing transaction: Gain on financing transaction for the three months ended March 31, 2025 of $14,085 is related to $12,818 of net gain related to adjustments to the fair market value of warrants and $1,527 of net gain related to fair market value adjustments of forward contract, offset by issuance costs of $260 realized upon the issuance of the Series C Preferred Units and warrants.
Net income (loss) per share attributable to common stockholders – Basic and Diluted: Refer to the Quarterly Report on Form 10-Q for additional information.
Loss on interest rate swap: Related to the amount of realized loss reclassified from accumulated other comprehensive income (loss) into earnings.
Unrealized gain (loss) from interest rate swap: Related to the mark-to-market adjustment of the Company’s de-designated interest rate swaps.
Non-GAAP Measurements:
Gain (loss) on sale of real estate: See definition above in the Consolidated Statements of Operations section.
Gain (loss) on financing transaction: See definition above in the Consolidated Statements of Operations section.
Pro forma effect of acquisitions/developments: Represents the estimated impact of wholly-owned acquisitions and development properties as if they had been acquired or stabilized on the first day of each respective quarter in which the acquisitions occurred or developments were placed in-service. We have made a number of assumptions in such estimates and there can be no assurance that we would have generated the projected levels of EBITDA had we owned the acquired properties and/or placed the development properties in-service as of the beginning of the respective periods.
Recurring capital expenditures: Excludes non-recurring capital expenditures of $3,903 and $3,000 for the three months ended March 31, 2025 and 2024, respectively.
Redeemable Non-controlling interest - Series C Preferred Units: See definition on page 33 in the Balance Sheet section.
Weighted-average common shares and units outstanding: Weighted-average common shares and units outstanding includes common stock, OP units, and restricted stock units as of March 31, 2025 and excludes 137,393 performance stock units as they are deemed to be non-participatory.
Q1 2025 Supplemental | 35