Exhibit 99-3
![]()
FOURTH QUARTER 2023 PREPARED COMMENTARY
FEBRUARY 21, 2024
Beginning with this quarter, we have provided more detailed commentary on our reported results and 2024 outlook ahead of the earnings conference call. Our hope is that by doing so, analysts and investors can have more time to read through and understand the results before we go straight to Q&A. This prepared commentary should be read in conjunction with the earnings press release, quarterly supplemental financial information and, when filed, the 2023 Form 10-K. All this information can be found on our Investor Relations page at ir.plymouthreit.com.
Before we get into the relevant detail from each area of the company, we’d like to call out some of the important takeaways from the quarter and the year:
| · | The results were in line with our expectations for the quarter and within the full year range for both Core FFO and net income at $1.84 per share and unit and $0.20 per weighted average common share, respectively. Additionally, AFFO was $1.73 per share and unit. |
| · | SSNOI growth for the quarter delivered as we described on the third quarter earnings call with a 9.7% increase on a cash basis – bringing us in at an increase of 7.6% for the year and above the midpoint of our guidance. |
| · | We finished the year with strong leasing results in Q4 that brought us in slightly above the high end of our expected mark-to-market (previously quoted as 18% to 20%). |
| · | We have one project left to deliver in our current development program that will come online in mid-2024. The occupancy in development projects is now 86%. |
| · | Net debt to Adjusted EBITDA decreased sequentially for the seventh quarter in a row. We ended the year at 6.5X, which is half a turn less than we had originally anticipated for 2023. |
| · | Based on these results and our outlook for 2024, effective with the first quarter of 2024 the Board has declared a 6.7% increase in the quarterly dividend to $0.96 per share on an annualized basis. |
| · | Our dividend payout ratio for 2023 was 48.9%; based on our full year 2024 guidance, the new dividend rate would equate to an FFO payout ratio of 50% to 51%. |
Golden Triangle Update
Since issuing our first report on the Golden Triangle in 2022 in conjunction with Avison Young, we have provided periodic updates on the trends in this region and why it’s important to Plymouth. We believe this region can continue to benefit from onshoring and nearshoring of manufacturing to the U.S., Mexico and Canada as well as the complementary wave of suppliers and distributors.
In November 2023, we posted our latest version (subsequently reposted this month with one correction on the percentage of the U.S. population reachable within this region) of the Golden Triangle analysis titled The “Golden” Era of U.S. Industrial Real Estate. This report and other information can be found on our website under the Golden Triangle page (https://www.plymouthreit.com/golden-triangle). Some of the key takeaways from this report were:
| · | Shifting port volume favors Tier II markets |
| · | Diversifying ports of entry shifts demand |
| · | Manufacturing favors Tier II markets |
| · | Lower square footage = lower vacancy |
| · | “Big Box” dominates supply injections |
| · | Constructions starts taper off |
| · | Population trends favor Tier II markets |
| · | Cost of living and labor favor Tier II markets |
We are in front of some trends in the Golden Triangle that we never could have anticipated when the Company was formed (although Harry Moser at the Reshoring Initiative did as early as 2010 – check him out at www.reshorenow.org). We’d like to think that buying the right assets in good industrial markets had something to do with it, but we’ll certainly take the assist from some of the world’s leading manufacturers who are making the decision to lead their companies, their suppliers and distributors to invest in this region. This is a trend we and others believe is measured in decades not years.
Just this week, Commercial Property Executive ran a story (https://www.commercialsearch.com/news/how-reshoring-impacts-industrial-real-estate/) on a recent report (https://www.naiop.org/forging-the-future) from the NAIOP Research Foundation, in partnership with Newmark, that highlighted how as it builds momentum, the ongoing reshoring could increase the size of the U.S. manufacturing base by 6% to 13% over 10 years. The article also noted that onshoring trends are encouraging nearshoring of manufacturing to Mexico and Canada. Some of the other highlights from the report and the article line up with what we’ve been saying in our Golden Triangle reports:
2
| · | Investment in new manufacturing facilities has been concentrated in the Midwest and Southeast. |
| · | Most new construction is expected to be in secondary or tertiary market locations that can offer adequate supplies of affordable energy and skilled labor. |
| · | Although most new manufacturing construction will be build-to-suit or owner-built, demand for speculative manufacturing space will also exist, as will demand for logistics real estate and other types of commercial space in the communities around new plants. |
Plymouth Market Commentary
According to the latest Cushman & Wakefield, Moody’s Analytics CRE and CBRE EA data, Plymouth’s markets are experiencing better trends than the broader national story on the industrial market in Q4 2023 and what is projected for 2024. Cushman & Wakefield noted the following in their U.S National Industrial Q4 2023 Heartbeat report: (https://cw-gbl-gws-prod.azureedge.net/-/media/cw/marketbeat-pdfs/2023/q4/us-reports/industrial/us_industrial_marketbeat_q4_2023.pdf?rev=732899321f7840ad8f76ef3fb2d03d68)
| · | Overall industrial demand, while tempered a bit from the past two years, remains in line with historical norms. For Q4 2023, overall net absorption came in at 41.1 million SF, down marginally from the previous quarter. The annual total of 224.3 million SF was on par with the 10-year pre-pandemic (2010-2019) average of 224.8 million SF. |
| · | Three-fourths of U.S. markets tracked by Cushman & Wakefield recorded positive absorption for the year, including all of Plymouth’s markets. Meanwhile, coastal markets, such as Southern California, New Jersey, Oakland/East Bay and the Pacific Northwest yielded notable occupancy losses. |
| · | New leasing activity, while down in the second half of the year, remained healthy. The 133.8 million SF reported in Q4 was 9.3% higher than the 10-year pre-pandemic quarterly average and helped push the 2023 total to 588 million SF, the fifth-strongest year on record. |
| · | Overall vacancy continued to edge upward during Q4, rising 70 basis points to 5.2%, marking the first time the rate surpassed the 5% mark since the third quarter of 2020. Historically speaking, however, occupancy remains tight, as the vacancy rate resides 180 bps lower than the 10-year pre-pandemic historical average of 7%. |
| · | The Midwest is now the tightest region, at 4.6%, while the South posted the highest vacancy rate (6.0%) due to the abundance of new supply delivering to the market. |
3
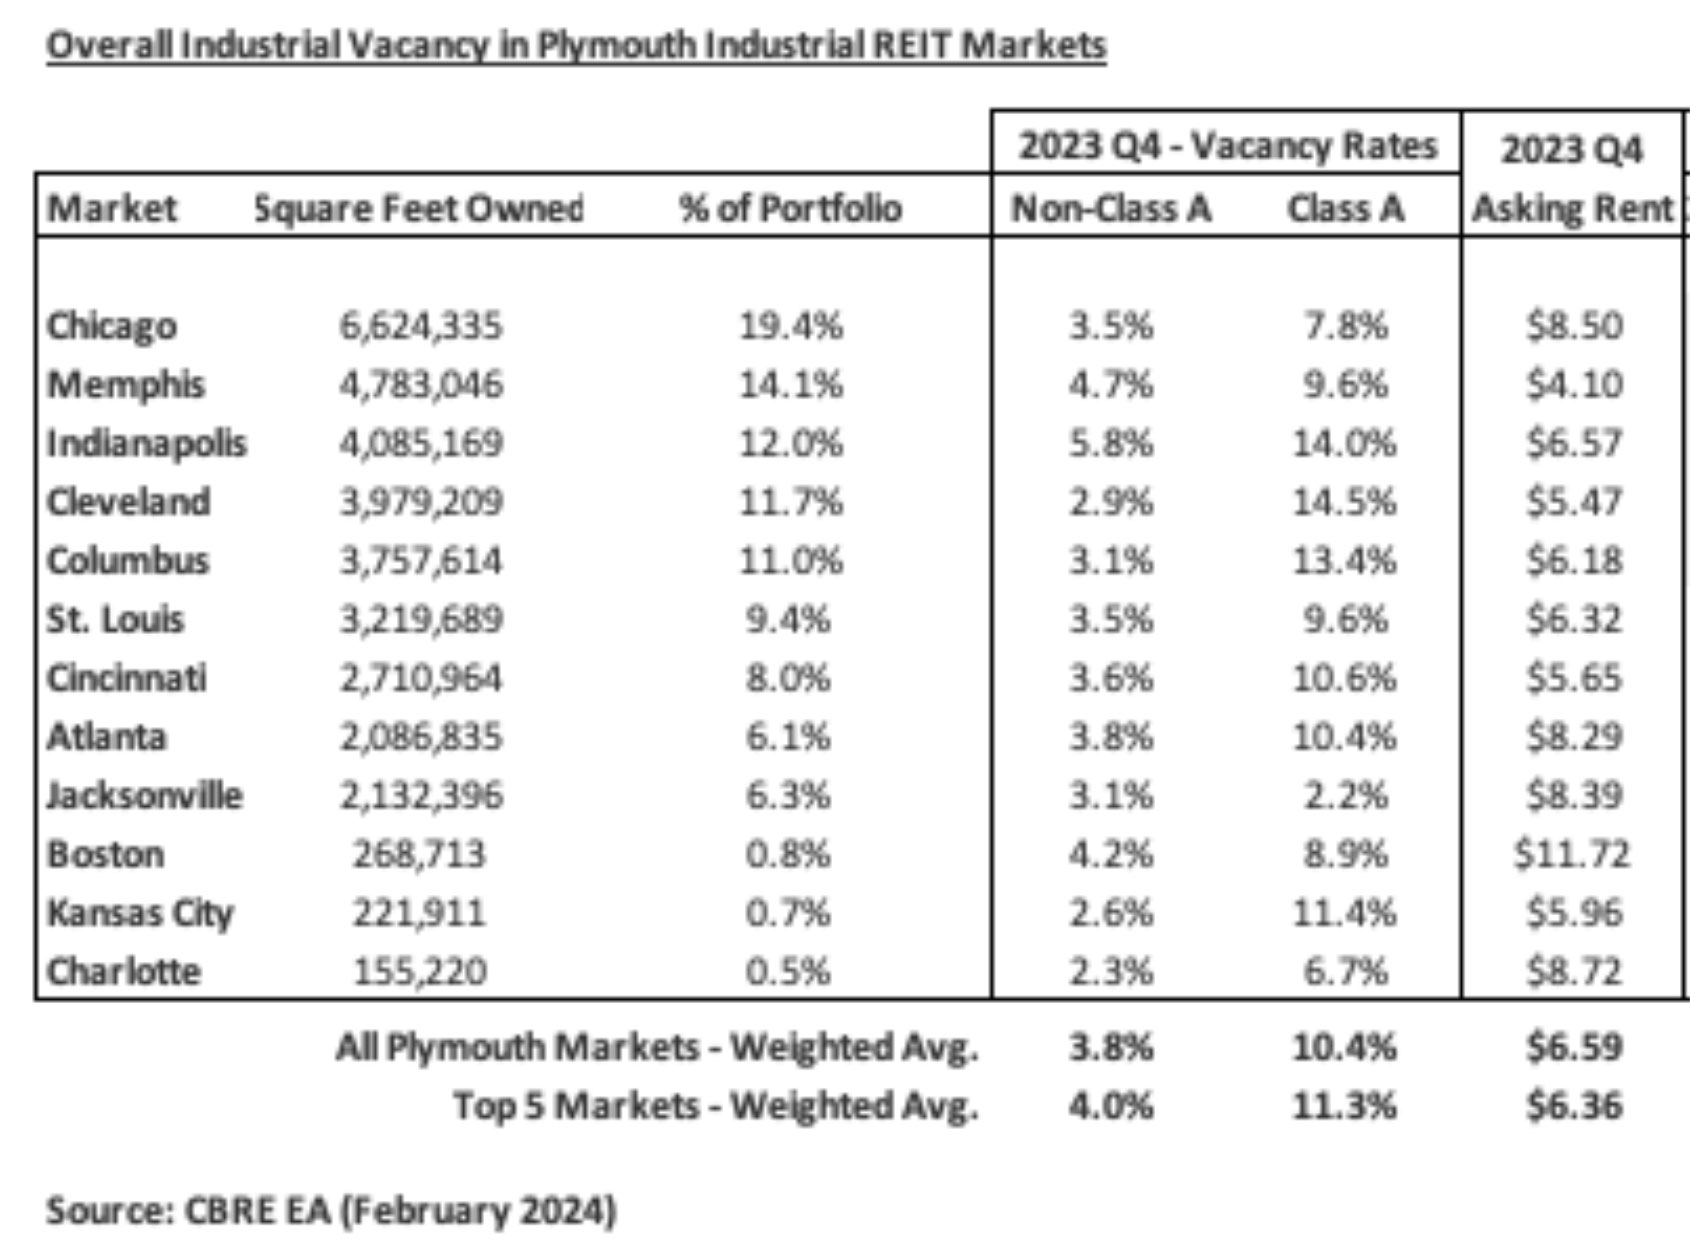
The data from CBRE shows in the chart above that the vacancy rate for larger Class A buildings is nearly three times more than smaller Class B properties, which supports the thesis that the increase in vacancy is largely due to big box speculative development coming online. According to Cushman & Wakefield, over 600 million SF was delivered in 2023 with 84% of new deliveries speculative, and only one-fourth of that space ended up being preleased before completion. However, new supply is expected to start to subside in 2024, as the pullback in construction starts constricts future development with the volume of space under construction dipping below the 500 million-SF mark for the first time since mid-year 2021. It now stands at 452.6 million SF, down 33.7% year-over-year at the close of 2023.
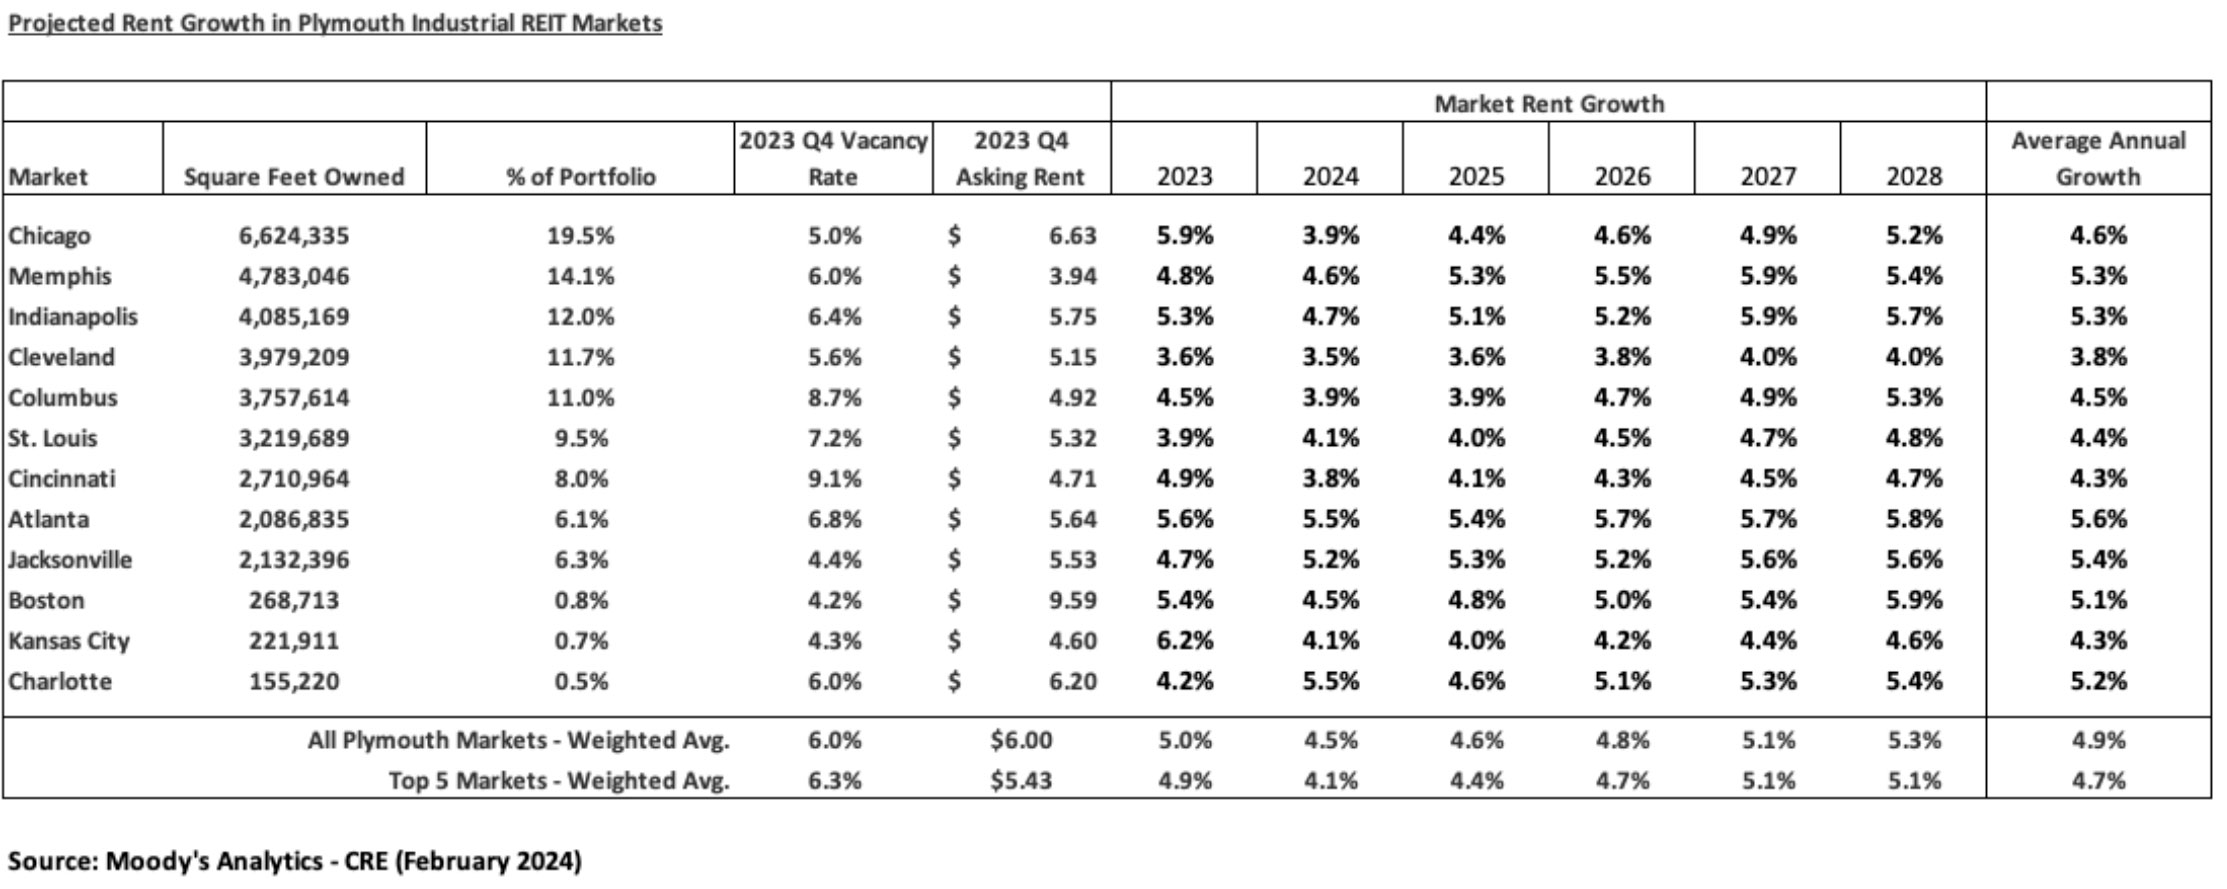
Nationally, asking rents are still projected to increase during 2024 but the overall growth rate will decelerate with a modest increase in vacancy rates and normalizing leasing totals. In Plymouth markets, according to Moody’s Analytics CRE data (which we’ve highlighted in the chart below), asking rents increased 5.0% during 2023 and are forecasted to grow 4.5% in 2024 with a five-year average annual asking rent growth of 4.9%. Charlotte, Atlanta and Jacksonville are all above 5% projected growth rates in 2024 with all other markets close to 4% or slightly above that range. Our markets are projected to be higher than the CBRE national five-year average asking rate increase of 3.5%.
4
Development Program Update
We are nearing the completion of the first phase of our development program. During Q4, we delivered a fully leased 39,750-square-foot industrial building in Jacksonville and are projecting the delivery of the final project, a 52,920-square-foot fully leased industrial building in Jacksonville to occur in Q3 of this year.
As of year-end, occupancy across the entire 772,622-square-foot program is 86%. For the remaining 107,000 square feet yet to be leased in Cincinnati, we have a lease out for signature for 54,000 square feet of this space, and we have several RFPs out with tenants on the balance. Once this lease that’s out for signature is signed, occupancy across the entire development program will be at 93%.
The development program will ultimately represent a total investment of $68.5 million, $62.7 million of which has been funded (see page 4 of the supplemental). The proforma stabilized cash NOI yields on the projects under construction and completed range between 7% to 9%. The program has successfully unlocked value we had carried on the balance sheet from undeveloped land while adding scale in Jacksonville, Cincinnati and Atlanta.
While this program has been a success, going forward any new development we pursue will be build-to-suit opportunities on the remaining land. We can potentially develop up to 1.6 million additional square feet on the 110 acres we own in seven markets (see page 11 of the supplemental). We are actively marketing a large portion of this space and would need to see a minimum return hurdle in the high-single-digit range to execute.
5
Leasing Update
While 2022 certainly had significantly more leases with 7.6 million square feet executed (see page 12 of the supplemental), we believe 2023 was our most substantial year of leasing. The reason for this is that we were able to continue the momentum we had established a year ago and push our blended rental rates to 21.0% on a cash basis, a full 100 basis points above our mark-to-market range of 18% to 20%.
The leasing results for Q4 and full year 2023 are broken down as follows for leases commencing during these periods (calculated on a cash basis and excluding development program leases):
| · | Fourth quarter |
| o | 664,157 SF of renewal leases signed at a 19.5% increase |
| o | Renewal rate was 68.7% |
| o | 0.2% of these renewals were contractual, which are typically at a lower rental rate and are frequently exercised earlier in the year |
| o | 302,010 SF of new leases signed at a 31.4% increase |
| o | Blended increase of 23.4% (Q1: 15.9%; Q2: 19.3%; Q3: 24.1%) |
| · | Full year 2023 |
| o | 3,945,024 SF of renewal leases signed at a 16.3% increase |
| o | Renewal rate was 70.4% |
| o | 10.7% of these renewals were contractual |
| o | 1,654,919 SF of new leases signed at a 31.7% increase |
| o | Blended increase of 21.0% (2022: 18.5%; 2021: 11.1%; 2020: 8.7%) |
We’ve done a good job of already getting to over 45% of our 2024 leases originally scheduled to mature in 2024, for the second year in a row we have a smaller-than-usual amount of our portfolio rolling in 2024 due to early renewals and a continued proactive approach from our asset management team. To quantify how much leasing we’ve taken care of advance, we would note that in the Q4 2022 supplemental, we had 6.6 million square feet, or 18.9% of total ABR, remaining to expire in 2024 as of December 31, 2022. The leasing expiration chart in the Q4 supplemental discloses we had 4.6 million square feet, or 13.4% of total ABR remaining to expire in 2024 as of December 31, 2023. Based on the leasing we’ve completed since year end, the square footage remaining to expire is now down to approximately 3.7 million square feet. Our largest leasing opportunity will be in 2025 with 23.2% of the portfolio expiring and another 16.7% rolling in 2026, so it will be important to maintain leasing momentum here in 2024. If you add in annual lease escalators that now average above 3% across the portfolio, we have a significant opportunity to drive organic growth through our leasing activities.
6
We’re off to a good start in 2024 and, on a blended basis, rental rates are 230 basis points ahead of where we were at this time a year ago even with the heavy weighting of contractual renewals muting the renewal rent increase. Based on the blended rate of 15.7% achieved to date and the leases yet to expire, we estimate the mark-to-market in the portfolio to be 18% to 20%.
| · | Full year 2024 (executed through February 19, 2024) |
| o | 2,466,864 SF of renewal leases signed at a 12.1% increase |
| o | Renewal rate so far of 77.5% |
| o | 34.0% of these renewals were contractual |
| o | 714,578 SF of new leases signed at a 28.7% increase |
| o | Blended increase of 15.7% |
As we’ve noted in our Q4 activity update from early January and again in the Q4 earnings release, our largest lease expiration in 2024 is the 769,500-square-foot single-tenant lease at our Class A industrial building in the Metro East submarket of St. Louis.
We are operating under the assumption, that the tenant will be vacating the building upon its lease expiration on July 31, 2024 and have been actively marketing the space for lease. In our full year 2024 guidance (see page 5 of the supplemental) we have assumed at the low end of the range that the tenant will vacate at expiration and the building will remain vacant through the balance of 2024. At the mid-point of the range, we have assumed the tenant renews or the space is released before July 31, 2024. Given the different scenarios surrounding this property and how it’s likely to be treated as a separate event altogether by the investment community, we have removed it from the same store pool calculation. It is now one of the six properties excluded from the 2024 same store pool for redevelopment/repositioning.
Here are the possible scenarios with this property (we have not handicapped any of these as more likely than the other, but they are all possible):
| · | The tenant is able to replace the current customer it serves with another customer(s) and desires to keep all or a portion of the space. This decision could happen anytime between now and for however long the space remains available. |
| · | A new tenant signs a lease for the space (again, we have pre-emptively begun marketing the space and will be rolling out a new national ad campaign very soon) and takes occupancy between August 1, 2024 and year end or for however long the space remains available. It’s too early to make any predictions whether a new lease would be a roll up or a roll down in rate. Rate would be impacted by term and incentive package provided. Regardless, we expect it will be market competitive. |
7
| · | We could demise the interior of the building into two spaces with an interior wall, potentially with the existing tenant along with a new tenant or two new prospects. This building was constructed to be able to accomplish this split, but there would be a cost involved in doing so. Should we need to follow this approach to effect leasing, we estimate the cost to be approximately $250,000 to $300,000. We also have available land on the property where we could expand by approximately 200K SF or lease out the land as storage to make it more attractive to potential users. Flexibility at this location will allow us to accommodate a myriad of potential users. |
We will continue to provide updates as necessary on material developments with this property, but it’s clearly our biggest leasing priority in 2024. The building is located in an attractive park with access to major interstates in the St. Louis area. We are confident we will be able to get this building leased given its location and recent build.
Looking across the portfolio, there are no other 2024 expirations that are within our top 10 list (see page 15 of the supplemental). We are close to extending the 330K SF lease at 3650 Distriplex in Memphis into 2025, which we discussed as a possibility on the Q3 call. There are two known moveouts that we discussed on the Q3 call. The first is for 314K SF in Chicago which occurred at the end of 2023. We are actively marketing that space and the moveout is baked into guidance, but we have a number of very good prospects looking at the space, including interest from another in-place tenant. At 9150 Latty Avenue in St. Louis, we agreed to terms with a new tenant for a 10-year lease and expect to have that 142,364-square-foot lease fully executed in a couple of weeks. Total portfolio occupancy will be impacted by 100 to 200 basis points while these roll-overs are addressed, but same store occupancy will not be impacted.
Disposition Update
Earlier in the year, we identified several buildings that would be good candidates for dispositions either because they were in a market where we had not been able to gain scale or if it wasn’t a great fit within the portfolio.
Our first disposition of the year was a 306,552-square-foot building at 6510 West 73rd Street in Chicago on September 8. This building in Chicago was a prime example of not being a great fit in the portfolio. It was better suited for a tenant/user to own it, and that’s exactly what happened. We sold the property for $19.9 million, which was a price of $65 per square foot, yielding a 4.95% cap rate on in-place NOI and an IRR of 31.1% over a six-year period. As we noted at the time of sale, the lower cap rate was indicative of a user purchase. After paying off a $6.7 million mortgage secured by the property, we used the $13.2 million in proceeds to help eliminate the remaining Series A Preferred Stock.
8
We completed our second disposition of the year during the fourth quarter. This was our 156,634-square-foot industrial building in Marlton, New Jersey. We sold this building in November for $16.8 million to an institutional investor at a price of $107 per SF, generating $16.2 million in net proceeds with a 6.3% cap rate on in-place NOI and an IRR of 18.2% over a nine-year hold. We used the net proceeds to pay down outstanding borrowings on our credit facility. This was our only building in the market, and it was a good real estate decision to sell it.
We have identified a handful of potential dispositions that we could explore in 2024 and 2025. We would expect that these sales – much like the ones in New Jersey and Chicago – could provide a good look through on value and would be done for good real estate decisions. After all, we sold both of those properties at substantial IRRs and at prices/SF well above our implied enterprise value/SF and at cap rates well below our implied cap rate.
More importantly, these potential dispositions would serve as accretive sources of capital to fund additional growth opportunities or, at a minimum to pay down debt. Our preference would be to redeploy to acquisitions where we could earn the spread over and above the exit cap rate on the sale. We would estimate that these potential dispositions could generate net proceeds of $20 million to $50 million in 2024.
Balance Sheet Update
We believe the balance sheet is the strongest it’s ever been based on our lowest net debt to adjusted EBITDA after seven quarters of reducing leverage, the elimination of both Series A and Series B Preferred Stock, well laddered maturities, and a high percentage of unsecured and fixed rate debt. We have done a lot of heavy lifting on the balance sheet.
Some of the balance sheet highlights as of December 31, 2023 are as follows (see page 10 of the supplemental):
| · | Net debt to EBITDA of 6.5X |
| · | 69.3% of our total debt is unsecured |
| · | 93.7% of our debt is fixed, including with the use of interest rate swaps with a total weighted average cost of 3.99% |
| · | $194.6 million of availability on our unsecured credit facility |
| · | Our only debt maturity until August 2025 is a life company secured mortgage loan totaling $18.4 million that matures in August 2024, which we plan to pay off through borrowings on the credit facility |
9
We took care of our largest debt maturity this year with the refinancing of the $107 million (net of reserves) secured AIG loan in early November with the use of our unsecured credit facility. As we disclosed in mid-November we entered into three different interest rate swap agreements with a total notional amount of $100 million to fix the USD-SOFR floating rate on our unsecured revolving credit facility at a weighted average rate of 4.7537% until its maturity in August 2025. Our spread on that facility translates to an all-in cost of 6.4037% as of December 31, 2023. We entered into these agreements in tranches so that if we decided to redeploy disposition proceeds in bigger chunks ahead of maturity we could do so.
Eliminating this AIG maturity along with the Series A and Series B – should ultimately help us in our ongoing discussions with the rating agencies and position us well to access the unsecured notes market in 2025.
Discussion of Fourth Quarter of 2023
The fourth quarter saw Core FFO at $0.47 per share driven by sequential improvement in leasing spreads within our same store portfolio, contributions from our phase 1 developments, namely Jacksonville and Atlanta, and slightly lower than anticipated interest expense.
Same store NOI, excluding early termination fees, experienced a 9.7% increase on a cash basis during the quarter – bringing us in at an increase of 7.6% for the year, just above the midpoint of our guidance. Same store performance reflects the sequential growth in revenue from our new and renewal leasing in the portfolio supported by improved expense reimbursement as we convert expiring rollover to triple-net lease structures resulting in a 330-basis point improvement in our expense recovery rate in FY 2023 compared with 2022.
G&A for the quarter was up slightly more than anticipated for the quarter, however, was consistent with Q4 2022 results; bringing total G&A in at 11.2% of cash NOI for FY 2023, a 210-basis-point improvement compared with FY 2022.
While slightly better than expected, interest expense during the fourth quarter reflected the net impact of the AIG refinancing using the line of credit and the $100 million of interest rate swaps that were executed. As of December 31, 2023, our only variable rate exposure is the $55.4 million of the $155.4 million outstanding balance on the line of credit that has not been fixed via interest rate swaps.
10
Discussion of 2024 Guidance and Assumptions
For our FY 2024 outlook (see page 5 of the supplemental), absent the potential impacts from the leasing surrounding the 769,500-square-foot building in St. Louis, we anticipate the quarterly cadence within Core FFO to trend very similar to FY 2023, with Q1 being more muted as a result of weather-related impacts and the timing of professional fees, then ramping up during the second half of the year as the balance of phase 1 developments stabilize, and we execute on the reminder of 2024 lease expirations. With 93.7% of our debt fixed (inclusive of interest rate swaps) and only $18.4 million of 2024 debt maturities, we do not anticipate interest rate variability being notable.
Additionally, similar to what we’ve experienced in the second half of 2023, we expect GAAP rent adjustments to remain subdued (meaning that there are less straight line rent addbacks in Core FFO to report and therefore to project in guidance or modeling) as market rent adjustments recorded upon prior acquisitions continue to burn off, coupled with a decline in free rent and other lease incentives during recent lease executions and negotiations. This trend also means that NOI on a GAAP basis is now converging with NOI on a cash basis.
Our FY 2024 guidance ranges for net loss and Core FFO per weighted average common share and units are noted below:
| (Dollars, shares and units in thousands) | Full Year 2024 Range | |||||||
| Low | High | |||||||
| Core FFO attributable to common stockholders and unit holder per share | $ | 1.88 | $ | 1.92 | ||||
| Same Store Portfolio NOI growth – cash basis2 | 7.00% | 7.50% | ||||||
| Average Same Store Portfolio occupancy – full year | 97.5% | 98.5% | ||||||
| General and administrative expenses3 | $ | 15,650 | $ | 15,150 | ||||
| Interest expense, net | $ | 37,650 | $ | 37,150 | ||||
| Weighted average common shares and units outstanding4 | 45,880 | 45,880 | ||||||
Reconciliation of net income attributable to common stockholders and unit holders per share to Core FFO guidance:
| Full Year 2024 Range | ||||||||
| Low | High | |||||||
| Net loss | $ | (0.12 | ) | $ | (0.08 | ) | ||
| Real estate depreciation & amortization | 2.00 | 2.00 | ||||||
| Core FFO | $ | 1.88 | $ | 1.92 | ||||
11
Our main assumptions for the projected FY 2024 Core FFO range of $1.88 to $1.92 per weighted average common share and units are:
| · | As mentioned earlier, the low end of the range assumes that the tenant at our 769,500-square-foot building in St. Louis will vacate at expiration and the building will remain vacant throughout the balance of 2024. The midpoint assumes that the in-place tenant renews or the space is fully released before July 31, 2024. |
| · | No prospective acquisitions, dispositions or capitalization activities. |
| · | Same store NOI growth on a cash basis in the range of 7.00% to 7.50%, which includes 25 basis points of non-specific vacancy and credit loss. This range assumes same store pool occupancy of 97.5% to 98.5%, with the pool now representing approximately 92% of the total in-place portfolio square footage. |
| · | G&A of $15.7 million to $15.2 million, inclusive of non-cash stock compensation of $4.1 million for 2024. |
| · | Interest expense of $37.7 million to $37.2 million assumes no incremental borrowings to fund the remaining phase 1 of our development program and utilizing the line of credit to repay the upcoming $18.4 million maturity in August 2024 |
Thoughts on the Transaction Environment and How We Grow from Here
Internally, we always stress the importance of how we grow and how we will fund that growth in a way that creates value for stockholders. For 2024, we’re anticipating 3%+ growth in Core FFO at the midpoint with no impact from additional acquisitions, dispositions or developments assumed at this time. The composition of this growth projected in 2024 is primarily from three primary sources of improved portfolio operations:
| · | SSNOI continues to be the leading source of organic growth with the second straight year of expectations for growth in the 7% range. Approximately 92% of our portfolio is now in the same store pool. |
| · | Stabilization of the 651,614 SF of development space brought online throughout 2023 at yields between 7% and 9% to contribute to year-over-year results. |
| · | Improvement in NOI margin by 150 basis points expected year-over-year at the midpoint of 2024 guidance due to portfolio optimization and the continued transition to NNN leases. |
While we have not factored inorganic growth into our 2024 guidance, there is a possibility that could come into play. We believe the transaction market has begun to unlock as we are seeing more deals in our markets starting to price within a range at which we would transact.
12
Our primary focus is on accretive growth. Absent a transformational type of opportunity, the hurdle would likely need to be in the 7% range for us to execute. The pipeline of new deals that we’re actively considering – which of course will be heavily filtered asset by asset – that are a good fit right now for the REIT is roughly $500 million in size.
For larger deals that might be better funded with a JV partner, the pipeline is four times larger. They range in size from the smaller portfolios such as the one we acquired in Memphis to others that are transformative in size. We have structured stockholder friendly JVs in the past and would only pursue something that would be accretive and best suited for REIT ownership in the near future.
How We Expect to Fund Growth
With this outlook for the transaction market to start unlocking, it’s natural to ask how we intend to fund this growth. Our preference is to fund it through a combination of disposition proceeds, borrowings on the credit facility, unsecured notes and/or selective ATM usage.
Our answer to how we are going to fund growth opportunities (absent a transformational type opportunity as noted earlier) is that transaction must be accretive to Core FFO growth from day one with the ability to drive returns higher from there by attacking lease roll. We are leaders in our markets and use our full-service platform to better understand each property and the value that we can realize through our asset and property management strategies. We know our cost of capital needs to improve. We believe it has improved and should continue to do so – that’s one of the significant value creation opportunities available to our stockholders.
We’re on record as recently as the Q3 call to note that we have no intention of taking leverage back to where it was the last several years. Our long-term leverage target has been net debt to EBITDA of 5-7X, and we are well within that range now. We believe we can continue to get to the lower end of our leverage target over time and in a manner that’s appropriate for a company of our current market capitalization while also continuing to improve our valuation multiple.
To fund potential growth opportunities in 2024, we intend to stay in the 6X range in terms of net debt to EBITDA. That gives us flexibility to go a little below where we are at year end 2023 to slightly above it to complete a transaction – assuming that we don’t have disposition proceeds to help offset those borrowings as well. Our bias for 2025 would be to operate at the low end of the 6X range.
13
Conclusion
We hope that this detailed commentary has been useful. 2023 was an important year for Plymouth, and we executed on just about everything we needed to get right this year. We have a few challenges ahead of us in 2024 that we’re confident we can turn into opportunities. We know how to lease these properties, manage them, take care of them and finance them.
Thank you for your continued interest and investment in Plymouth.
Jeff Witherell, Chairman and CEO
Forward-Looking Statements
This commentary includes “forward-looking statements” that are made pursuant to the safe harbor provisions of Section 27A of the Securities Act of 1933 and of Section 21E of the Securities Exchange Act of 1934. The forward-looking statements in this release do not constitute guarantees of future performance. Investors are cautioned that statements in this commentary, which are not strictly historical statements, including, without limitation, statements regarding management's plans, objectives and strategies, constitute forward-looking statements. Such forward-looking statements are subject to a number of known and unknown risks and uncertainties that could cause actual results to differ materially from those anticipated by the forward-looking statement, many of which may be beyond our control, including, without limitation, those factors described under the captions “Cautionary Note Regarding Forward-Looking Statements” and “Risk Factors” in the Company’s Annual Report on Form 10-K and Quarterly Reports on Form 10-Q filed with the Securities and Exchange Commission. Forward-looking statements generally can be identified by the use of forward-looking terminology such as “may,” “plan,” “seek,” “will,” “expect,” “intend,” “estimate,” “anticipate,” “believe” or “continue” or the negative thereof or variations thereon or similar terminology. Any forward-looking information presented herein is made only as of the date of this commentary, and we do not undertake any obligation to update or revise any forward-looking information to reflect changes in assumptions, the occurrence of unanticipated events, or otherwise.
14