
Exhibit 99.2
F O U R T H Q U A R T E R 2 0 2 3 S U P P L E M E N T A L
| Plymouth Industrial REIT, Inc. |
| Table of Contents |
| Introduction | |||
| Executive Summary | 2 | ||
| Management, Board of Directors, Investor Relations, and Equity Coverage | 2 | ||
| Portfolio Statistics | 3 | ||
| Acquisition Activity | 3 | ||
| Value Creation | 4 | ||
| Development Projects | 4 | ||
| Guidance | 5 | ||
| Financial Information | |||
| Same Store Net Operating Income (NOI) | 6 | ||
| Consolidated Statements of Operations | 7 | ||
| Consolidated NOI | 8 | ||
| Earnings Before Interest, Taxes, Depreciation and Amortization for Real Estate (EBITDAre) | 8 | ||
| Funds from Operations (FFO), Core FFO & Adjusted Funds from Operations (AFFO) | 8 | ||
| Consolidated Balance Sheets | 9 | ||
| Capital Structure and Debt Summary | 10 | ||
| Capital Markets Activity | 10 | ||
| Net Asset Value Components | 11 | ||
| Operational & Portfolio Information | |||
| Leasing Activity | 12 | ||
| Lease Expiration Schedule | 12 | ||
| Leased Square Feet and Annualized Base Rent by Tenant Industry | 13 | ||
| Leased Square Feet and Annualized Base Rent by Type | 14 | ||
| Top 10 Tenants by Annualized Base Rent | 15 | ||
| Lease Segmentation by Size | 15 | ||
| Rentable Square Feet and Annualized Base Rent by Market | 16 | ||
| Total Acquisition and Replacement Cost by Market | 16 | ||
| Appendix | |||
| Glossary | 17 | ||
Forward-Looking Statements: This Supplemental Information contains forward-looking statements that are made pursuant to the safe harbor provisions of Section 27A of the Securities Act of 1933 and of Section 21E of the Securities Exchange Act of 1934. The forward-looking statements in this Supplemental Information do not constitute guarantees of future performance. Investors are cautioned that statements in this Supplemental Information, which are not strictly historical statements, including, without limitation, statements regarding management's plans, objectives and strategies, constitute forward-looking statements. Such forward-looking statements are subject to a number of known and unknown risks and uncertainties that could cause actual results to differ materially from those anticipated by the forward-looking statement, many of which may be beyond our control, including, without limitation, those factors described under the captions “Cautionary Note Regarding Forward-Looking Statements” and “Risk Factors” in the Company’s Annual Report on Form 10-K and Quarterly Reports on Form 10-Q filed with the Securities and Exchange Commission. Forward-looking statements generally can be identified by the use of forward-looking terminology such as “may,” “plan,” “seek,” “will,” “expect,” “intend,” “estimate,” “anticipate,” “believe” or “continue” or the negative thereof or variations thereon or similar terminology. Any forward-looking information presented herein is made only as of the date of this Supplemental Information, and we do not undertake any obligation to update or revise any forward-looking information to reflect changes in assumptions, the occurrence of unanticipated events, or otherwise.
Definitions and Reconciliations: For definitions of certain terms used throughout this Supplemental Information, including certain non-GAAP financial measures, refer to the Glossary on pages 17-18. For reconciliations of the non-GAAP financial measures to the most directly comparable U.S. GAAP measures, refer to page 8.
| Plymouth Industrial REIT, Inc. |
| Executive Summary |
| Company overview: Plymouth Industrial REIT, Inc. (NYSE: PLYM) is a full service, vertically integrated real estate investment trust company focused on the acquisition, ownership, and management of single and multi-tenant industrial properties. Our mission is to provide tenants with cost effective space that is functional, flexible and safe. |
| Management, Board of Directors, Investor Relations, and Equity Coverage |
| Corporate | Investor Relations | Transfer Agent | ||||||
| 20 Custom House Street, 11th Floor | Tripp Sullivan | Continental Stock Transfer & Trust Company | ||||||
| Boston, Massachusetts 02110 | SCR Partners | 1 State Street, 30th Floor | ||||||
| 617.340.3814 | IR@plymouthreit.com | New York, NY 10004 | ||||||
| www.plymouthreit.com | 212.509.4000 | |||||||
| Executive Management | ||||||||
| Jeffrey E. Witherell | Anthony J. Saladino | James M. Connolly | Lyndon J. Blakesley | |||||
| Chief Executive Officer | Executive Vice President | Executive Vice President | Senior Vice President | |||||
| and Chairman | and Chief Financial Officer | Asset Management | and Chief Accounting Officer | |||||
| Benjamin P. Coues | Anne A. Hayward | Daniel Hefferman | Scott L. Robinson | |||||
| Senior Vice President | Senior Vice President | Senior Vice President | Senior Vice President | |||||
| and Head of Acquisitions | and General Counsel | Asset Management | Corporate Development | |||||
| Board of Directors | ||||||||
| Philip S. Cottone | Richard J. DeAgazio | David G. Gaw | John W. Guinee | |||||
| Independent Director | Independent Director | Lead Independent Director | Independent Director | |||||
| Caitlin Murphy | Pendleton P. White, Jr. | Jeffrey E. Witherell | ||||||
| Independent Director | Director | Chief Executive Officer | ||||||
| and Chairman | ||||||||
| Equity Research Coverage1 | ||||||||
| Baird | BMO Capital Markets | BNP Paribas Exane | B Riley Securities | |||||
| Nicholas Thillman | John Kim | Nate Crossett | Bryan Maher | |||||
| 414.298.5053 | 212.885.4115 | 646.725.3716 | 646.885.5423 | |||||
| Colliers Securities | JMP Securities | J.P. Morgan | KeyBanc Capital Markets | |||||
| Barry Oxford | Mitch Germain | Mike Mueller | Todd Thomas | |||||
| 203.961.6573 | 212.906.3537 | 212.622.6689 | 917.368.2375 | |||||
| Truist Securities | ||||||||
| Anthony Hau | ||||||||
| 212.303.4176 | ||||||||
| Investor Conference Call and Webcast: The Company will host a conference call and live audio webcast, both open for the general public to hear, on February 22, 2024 at 9:00 a.m. Eastern Time. The number to call for this interactive teleconference is (844) 784-1727 (international callers: (412) 717-9587). A replay of the call will be available through February 29, 2024 by dialing (877) 344-7529 and entering the replay access code, 8599062. |
||
1) The analysts listed provide research coverage on the Company. Any opinions, estimates or forecasts regarding the Company's performance made by these analysts are theirs alone and do not represent opinions, estimates or forecasts by the Company or its management. The Company does not by reference above imply its endorsement of or concurrence with such information, conclusions or recommendations.
Page 2
| Plymouth Industrial REIT, Inc. |
| Portfolio Statistics |
| Unaudited ($ in thousands, except Cost/SF) as of 12/31/2023 |
| Portfolio Snapshot | Portfolio Growth ($ in millions)7 | |||||
| Number of Properties | 156 | 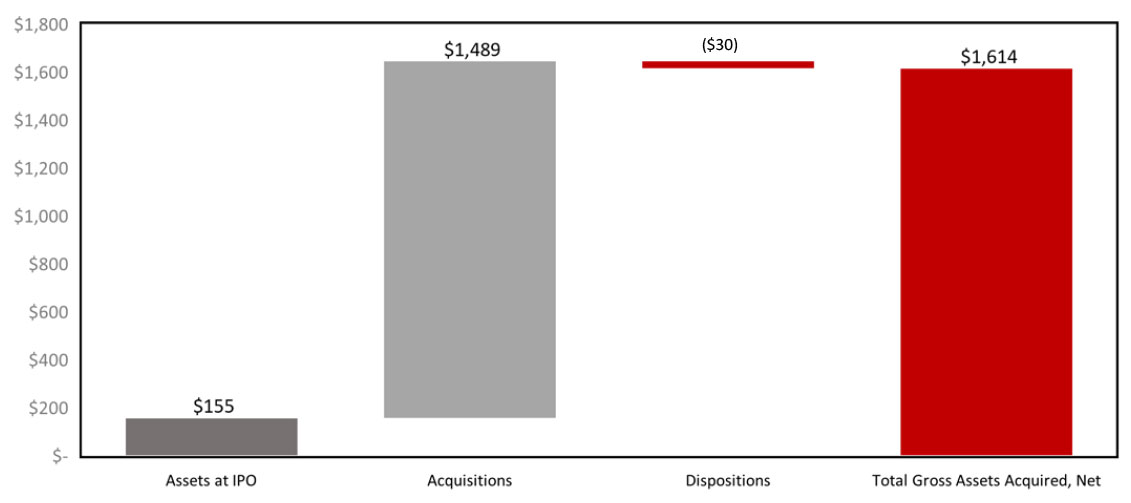 | ||||
| Number of Buildings | 211 | |||||
| Square Footage | 34,025 | |||||
| Occupancy | 98.1% | |||||
| WA Lease Term Remaining (yrs.)1 | 3.3 | |||||
| Total Annualized Base Rent (ABR)2 | $150,747 | |||||
| Q4 Rental Rate Increase - Cash Basis3 | 23.4% | |||||
| Q4 Rent Collections | 99.9% | |||||
| Acquisition Activity | |||
| Acquisitions | |||
| Location | Acquisition Date |
# of Buildings |
Purchase Price4 |
Square Footage |
Projected Initial Yield5 |
Cost per Square Foot6 | ||||||
| Multiple | Full Year 2022 | 44 | $ 253,655 | 4,164,864 | 6.1% | $ 71.54 | ||||||
| Multiple | Full Year 2021 | 24 | $ 370,977 | 6,380,302 | 6.7% | $ 63.15 | ||||||
| Multiple | Full Year 2020 | 27 | $ 243,568 | 5,473,596 | 7.8% | $ 46.99 | ||||||
| Multiple | Full Year 2019 | 32 | $ 220,115 | 5,776,928 | 8.4% | $ 42.21 | ||||||
| Multiple | Full Year 2018 | 24 | $ 164,575 | 2,903,699 | 8.2% | $ 70.54 | ||||||
| Multiple | 2017 (since IPO) | 36 | $ 173,325 | 5,195,563 | 8.4% | $ 33.81 | ||||||
| Total Acquisitions Post-IPO | 187 | $ 1,426,215 | 29,894,952 | 7.4% | $ 55.94 | |||||||
Portfolio statistics and acquisitions include wholly owned industrial properties only; excludes our property management office located in Columbus, Ohio.
| 1) | The average contractual lease term remaining as of the close of the reporting period (in years) weighted by square footage. |
| 2) | Annualized base rent is calculated as monthly contracted base rent as of December 31, 2023, multiplied by 12. Excludes rent abatements. |
| 3) | Based on approximately 1.0 million square feet of new and renewal leases greater than six months in term. Refer to Leasing Activity in this Supplemental Information for additional details. |
| 4) | Represents total direct consideration paid rather than GAAP cost basis. |
| 5) | Weighted based on Purchase Price. |
| 6) | Calculated as Purchase Price divided by square footage. |
| 7) | Acquisitions include capitalized costs in accordance to GAAP for development properties placed in-service. |
Page 3
| Plymouth Industrial REIT, Inc. |
| Value Creation |
| Unaudited ($ in thousands, except RSF) |
| Examples of Value Creation |
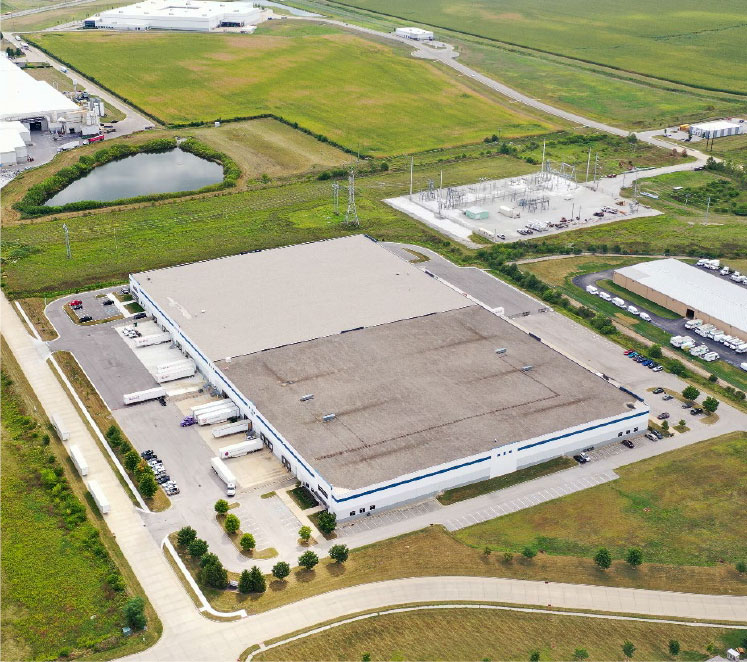
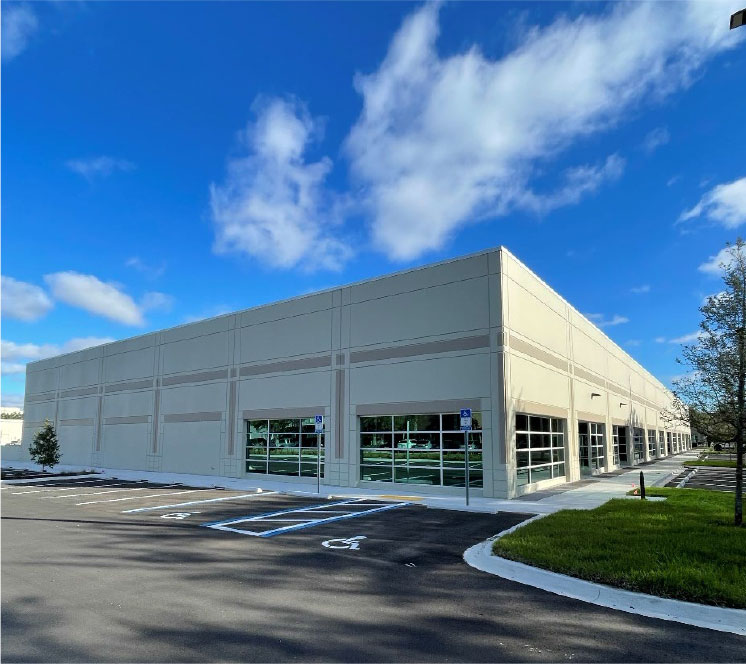
| Lease-up / Building Refurbishment | New Industrial Development | Disposition / Value Realized | ||
 |
 |
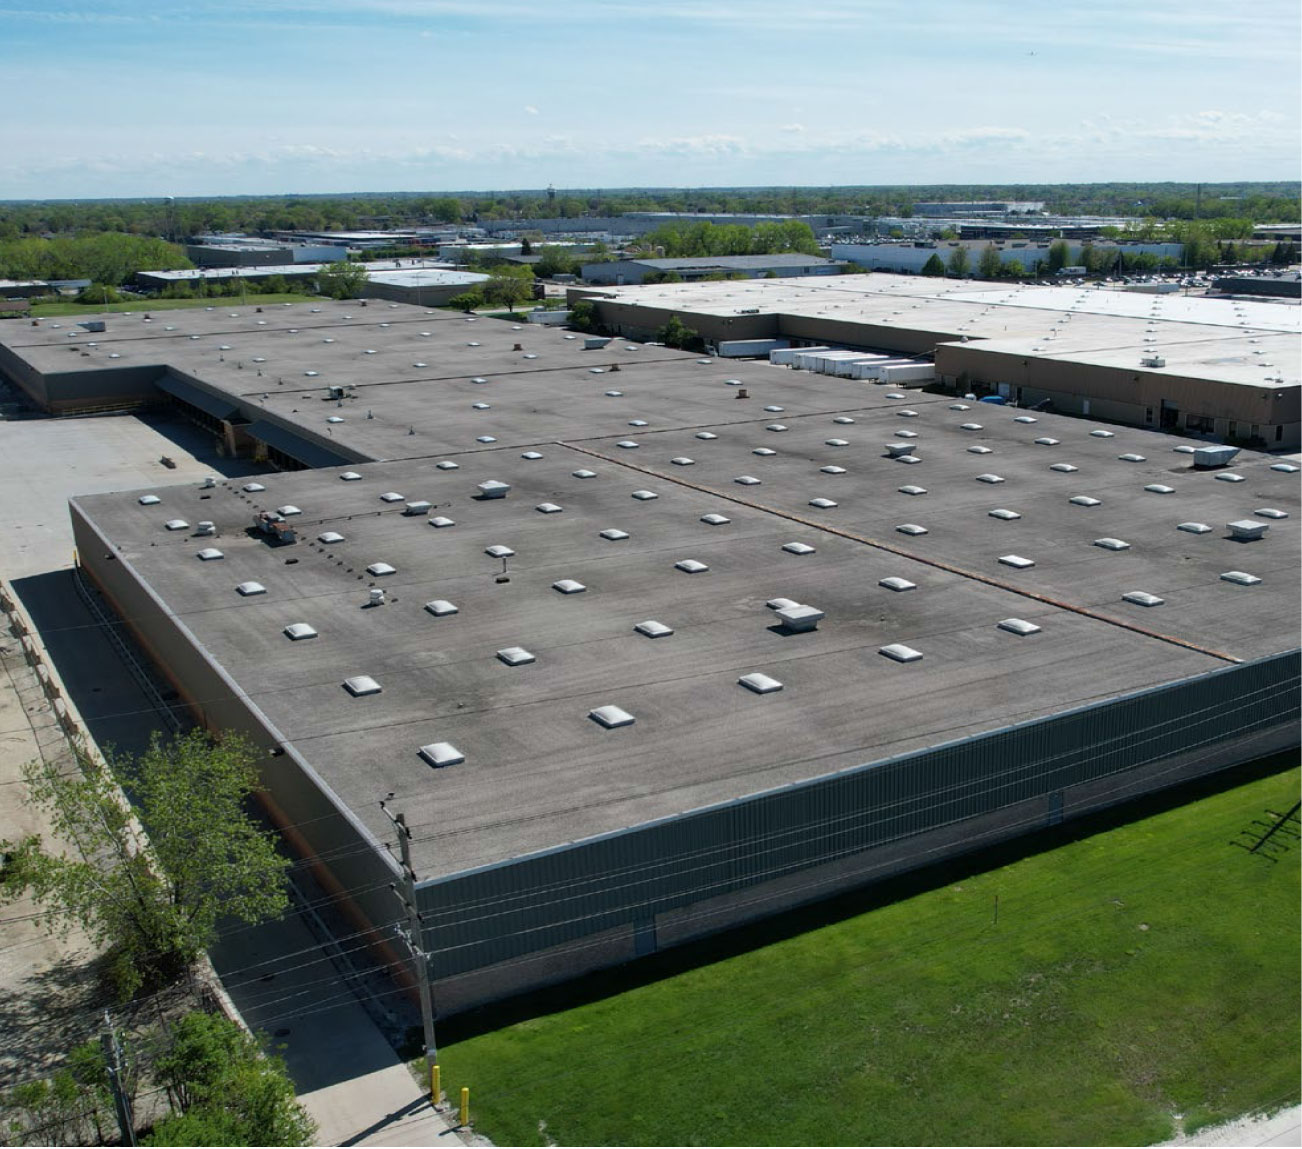 | ||
| Indianapolis | Jacksonville | Chicago | ||
| Expanded existing tenant in the building by an additional 42,910 square feet and extended term for 15 years at a rental rate increase of 18% over expiring rents. | Delivered two buildings in 2023 totaling 80,322 square feet, both of which are fully leased. | Sold a 306,552 square-foot industrial building at 6510 West 73rd Street in Chicago. | ||
| Expanded other existing tenant by an additional 147,310 square feet for 4 years without any downtime. | Commenced construction on a third, 100% pre-leased building at Liberty Business Park which will comprise 52,920 square feet. The anticipated delivery is Q3 2024. | Net proceeds after the payoff of a $6.7 million mortage, return of lender escrow reserves, and other adjustments were $14.0 million. | ||
| The property was acquired at a going-in yield of 6.9%. Stabilized yield is now 8% with leases with escalations averaging 3.75%. | Marketing an additional fully designed and permit-ready site at Liberty Business Park that can provide 41,958 square feet. | The disposition yielded a 4.9% cap rate on in-place NOI and an IRR of 31.1% over a six-year hold period. |
| Plymouth is partnering with the Green Building Initiative to align our environmental objectives with the execution of all new development and portfolio enhancement activities. Thus far Plymouth has achieved a Three Green Globe certification on our Cincinnati development and a Two Green Globe certification on both the Boston and first Atlanta developments.1 |
| Development Projects (as of 12/31/2023) |
| The Company has identified over 1.7 million SF of developable GLA with 52,920 SF currently under construction and 719,702 SF recently completed. The total investment in development currently under construction is approximately $1.6 million as of 12/31/2023 against a budget of approximately $7.4 million. The total investment in completed developments is approximately $61.1 million. The proforma stabilized cash NOI yields on development projects under construction and completed range between 7.0% - 9.0%. |
| Total Rentable | Estimated | ||||||||||
| Under Construction2 | # of Buildings | Square Feet (RSF) | % Leased | % Funded | Completion | ||||||
| Jacksonville - Liberty II | 1 | 52,920 | 100% | 22% | Q3 2024 | ||||||
| 1 | 52,920 | ||||||||||
| Total Rentable | |||||||||||
| Completed 3 | # of Buildings | Square Feet (RSF) | % Leased | % Funded | Completed | ||||||
| Boston - Milliken Road | 1 | 68,088 | 100% | 100% | Q4 2022 | ||||||
| Atlanta - New Calhoun I | 1 | 236,600 | 100% | 100% | Q1 2023 | ||||||
| Cincinnati - Fisher Park I | 1 | 154,692 | 31% | 100% | Q1 2023 | ||||||
| Atlanta - New Calhoun II | 1 | 180,000 | 40% | 100% | Q3 2023 | ||||||
| Jacksonville - Salisbury | 1 | 40,572 | 100% | 100% | Q3 2023 | ||||||
| Jacksonville - Liberty I | 1 | 39,750 | 100% | 100% | Q4 2023 | ||||||
| 719,702 |
| 1) | The Company is a member organization of the Green Building Initiative (GBI), a nonprofit organization and American National Standards Institute (ANSI) Accredited Standards Developer dedicated to reducing climate impacts by improving the built environment. Founded in 2004, the organization is the global provider of the Green Globes and federal Guiding Principles Compliance certification and assessment programs. |
| 2) | Under construction represents projects for which vertical construction has commenced. Refer to the Developable Land section of the Net Asset Components on page 11 of this Supplemental Information for additional details on the Company's development activities. |
| 3) | Completed buildings are included within portfolio occupancy and square footage metrics as of December 31, 2023. |
Page 4
| Plymouth Industrial REIT, Inc. |
| Guidance |
| Unaudited (in thousands, except per-share amounts) |
| Full Year 2024 Range1 | ||||||||
| Low | High | |||||||
| Core FFO attributable to common stockholders and unit holders per share | $ | 1.88 | $ | 1.92 | ||||
| Same Store Portfolio NOI growth - cash basis2 | 7.00% | 7.50% | ||||||
| Average Same Store Portfolio occupancy - full year | 97.5% | 98.5% | ||||||
| General and administrative expenses3 | $ | 15,650 | $ | 15,150 | ||||
| Interest expense, net | $ | 37,650 | $ | 37,150 | ||||
| Weighted average common shares and units outstanding4 | 45,880 | 45,880 | ||||||
Reconciliation of net loss attributable to common stockholders and unit holders per share to Core FFO guidance:
| Full Year 2024 Range1 | ||||||||
| Low | High | |||||||
| Net income/(loss) | $ | (0.12 | ) | $ | (0.08 | ) | ||
| Depreciation and amortization | 2.00 | 2.00 | ||||||
| $ | 1.88 | $ | 1.92 | |||||
| 1) | Our 2024 guidance refers to the Company's in-place portfolio as of February 19, 2024 and does not include the impact from prospective acquisitions, dispositions, or capitalization activities. |
| 2) | The Same Store Portfolio consists of 200 buildings aggregating to 31,245,756 rentable square feet, representing approximately 92% of the total in-place portfolio square footage. The Same Store projected performance reflects annual NOI growth on a cash basis, excluding termination income. The Same Store Portfolio is a subset of the consolidated portfolio and includes properties that are wholly owned by the Company as of December 31, 2022. The Same Store Portfolio excludes properties that are classified as repositioning, lease-up during 2023 or 2024 (6 buildings representing approximately 1,755,000 of rentable square feet) or under contract for sale. |
| 3) | Includes non-cash stock compensation of $4.1 million for 2024. |
| 4) | As of February 19, 2024, the Company has 45,872,375 common shares and units outstanding. |
Page 5
| Plymouth Industrial REIT, Inc. |
| Same Store Net Operating Income (NOI) |
| Unaudited ($ and SF in thousands) |
| Same Store Portfolio Statistics | |||
| Square footage | 30,833 | Includes1: wholly owned properties as of December 31, 2021; determined and set once per year for the following twelve months (refer to Glossary for Same Store definition) | |
| Number of properties | 137 | ||
| Number of buildings | 182 | ||
| Percentage of total portfolio square footage | 90.6% | Excludes2: wholly owned properties classified as repositioning, lease-up during 2022 or 2023 (8 buildings representing approximately 935,000 of rentable square feet) and under contract for sale. | |
| Occupancy at period end | 98.4% | ||
| Same Store NOI - GAAP Basis |
| Three Months Ended December 31, | ||||||||||||||||
| 2023 | 2022 | $ Change | % Change | |||||||||||||
| Rental revenue | $ | 44,972 | $ | 42,532 | $ | 2,440 | 5.7% | |||||||||
| Property expenses | 13,420 | 12,903 | 517 | 4.0% | ||||||||||||
| Same Store NOI - GAAP Basis | $ | 31,552 | $ | 29,629 | $ | 1,923 | 6.5% | |||||||||
| Same Store NOI excluding early termination income - GAAP Basis | $ | 31,528 | $ | 29,563 | $ | 1,965 | 6.6% | |||||||||
| Year Ended December 31, | ||||||||||||||||
| 2023 | 2022 | $ Change | % Change | |||||||||||||
| Rental revenue | $ | 177,502 | $ | 169,910 | $ | 7,592 | 4.5% | |||||||||
| Property expenses | 55,323 | 52,154 | 3,169 | 6.1% | ||||||||||||
| Same Store NOI - GAAP Basis | $ | 122,179 | $ | 117,756 | $ | 4,423 | 3.8% | |||||||||
| Same Store NOI excluding early termination income - GAAP Basis | $ | 121,862 | $ | 117,549 | $ | 4,313 | 3.7% | |||||||||
| Same Store NOI - Cash Basis |
| Three Months Ended December 31, | ||||||||||||||||
| 2023 | 2022 | $ Change | % Change | |||||||||||||
| Rental revenue | $ | 44,900 | $ | 41,635 | $ | 3,265 | 7.8% | |||||||||
| Property expenses | 13,420 | 12,903 | 517 | 4.0% | ||||||||||||
| Same Store NOI - Cash Basis | $ | 31,480 | $ | 28,732 | $ | 2,748 | 9.6% | |||||||||
| Same Store NOI excluding early termination income - Cash Basis | $ | 31,456 | $ | 28,666 | $ | 2,790 | 9.7% | |||||||||
| Year Ended December 31, | ||||||||||||||||
| 2023 | 2022 | $ Change | % Change | |||||||||||||
| Rental revenue | $ | 175,522 | $ | 163,821 | $ | 11,701 | 7.1% | |||||||||
| Property expenses | 55,323 | 52,154 | 3,169 | 6.1% | ||||||||||||
| Same Store NOI - Cash Basis | $ | 120,199 | $ | 111,667 | $ | 8,532 | 7.6% | |||||||||
| Same Store NOI excluding early termination income - Cash Basis | $ | 119,882 | $ | 111,460 | $ | 8,422 | 7.6% | |||||||||
| 1) | For the three months and years ended December 31, 2023 and 2022, our Same Store Portfolio includes the 28-building Memphis Industrial Portfolio which we acquired the remaining 80% interest in our former unconsolidated JV on March 11, 2022. |
| 2) | Sold a 306,552 square-foot building, 0.9% of Plymouth REIT's portfolio, at 6510 West 73rd Street in Chicago to an owner operator for net proceeds of $14.0 million. Additionally, a 156,634 square-foot building has been removed from the same store portfolio as it was disposed in Q4 2023 for net proceeds of $16.2 million. Refer to the 2023 Annual Report on Form 10-K for additional information. |
Page 6
| Plymouth Industrial REIT, Inc. |
| Consolidated Statements of Operations |
| Unaudited ($ in thousands, except per-share amounts) |
| For the Three Months Ended December 31, | For the Year Ended Decemer 31, | |||||||||||||||
| 2023 | 2022 | 2023 | 2022 | |||||||||||||
| Revenues: | ||||||||||||||||
| Rental revenue | $ | 38,642 | $ | 36,576 | $ | 151,458 | $ | 141,085 | ||||||||
| Tenant recoveries | 12,112 | 10,746 | 48,302 | 42,357 | ||||||||||||
| Management fee revenue and other income | 30 | 4 | 88 | 94 | ||||||||||||
| Total revenues | $ | 50,784 | $ | 47,326 | $ | 199,848 | $ | 183,536 | ||||||||
| Operating expenses: | ||||||||||||||||
| Property | 15,144 | 14,232 | 62,542 | 56,601 | ||||||||||||
| Depreciation and amortization | 22,793 | 23,553 | 92,891 | 95,312 | ||||||||||||
| General and administrative | 4,318 | 4,163 | 14,904 | 15,939 | ||||||||||||
| Total operating expenses | $ | 42,255 | $ | 41,948 | $ | 170,337 | $ | 167,852 | ||||||||
| Other income (expense): | ||||||||||||||||
| Interest expense | (9,686 | ) | (8,914 | ) | (38,278 | ) | (32,217 | ) | ||||||||
| Earnings (loss) in investment of unconsolidated joint venture1 | — | — | — | (147 | ) | |||||||||||
| Loss on extinguishment of debt | — | — | (72 | ) | (2,176 | ) | ||||||||||
| Gain on sale of real estate2 | 10,534 | — | 22,646 | — | ||||||||||||
| (Appreciation) depreciation of warrants3 | — | — | — | 1,760 | ||||||||||||
| Total other income (expense) | $ | 848 | $ | (8,914 | ) | $ | (15,704 | ) | $ | (32,780 | ) | |||||
| Net income (loss) | $ | 9,377 | $ | (3,536 | ) | $ | 13,807 | $ | (17,096 | ) | ||||||
| Less: Net income (loss) attributable to non-controlling interest | 101 | (40 | ) | 147 | (210 | ) | ||||||||||
| Net income (loss) attributable to Plymouth Industrial REIT, Inc. | $ | 9,276 | $ | (3,496 | ) | $ | 13,660 | $ | (16,886 | ) | ||||||
| Less: Preferred Stock dividends | — | 917 | 2,509 | 4,866 | ||||||||||||
| Less: Series B Preferred Stock accretion to redemption value | — | — | — | 4,621 | ||||||||||||
| Less: Loss on extinguishment/redemption of Series A Preferred Stock | — | 19 | 2,023 | 99 | ||||||||||||
| Less: Amount allocated to participating securities | 84 | 62 | 337 | 256 | ||||||||||||
| Net income (loss) attributable to common stockholders | $ | 9,192 | $ | (4,494 | ) | $ | 8,791 | $ | (26,728 | ) | ||||||
| Net income (loss) per share attributable to common stockholders - basic4 | $ | 0.20 | $ | (0.11 | ) | $ | 0.20 | $ | (0.67 | ) | ||||||
| Net income (loss) per share attributable to common stockholders - diluted4 | $ | 0.20 | $ | (0.11 | ) | $ | 0.20 | $ | (0.67 | ) | ||||||
| Weighted-average common shares outstanding - basic | 44,879 | 42,569 | 43,555 | 39,779 | ||||||||||||
| Weighted-average common shares outstanding - diluted | 44,992 | 42,569 | 43,632 | 39,779 | ||||||||||||
| 1) | Represents our share of earnings (losses) related to our investment in an unconsolidated joint venture. The Company acquired the remaining 80% interest in our unconsolidated JV in March 2022. |
| 2) | For the year ended December 31, 2023, the Company sold two properties totaling 463,186 square feet, recognizing a net gain of $22,646. |
| 3) | Represents the change in the fair market value of our common stock warrants. On March 23, 2022, the common stock warrants were exercised in full and converted on a cashless basis, resulting in 139,940 shares of common stock. |
| 4) | Refer to Note 13 in the 2023 Annual Report on Form 10-K for additional information. |
Page 7
| Plymouth Industrial REIT, Inc. | |||||
| Non-GAAP Measurements | |||||
| Unaudited ($ in thousands, except per-share amounts) | |||||
| Consolidated NOI | |||||
| For the Three Months Ended December 31, | For the Year Ended Decemer 31, | |||||||||||||||
| 2023 | 2022 | 2023 | 2022 | |||||||||||||
| Net income (loss) | $ | 9,377 | $ | (3,536 | ) | $ | 13,807 | $(17,096) | ||||||||
| General and administrative | 4,318 | 4,163 | 14,904 | 15,939 | ||||||||||||
| Depreciation and amortization | 22,793 | 23,553 | 92,891 | 95,312 | ||||||||||||
| Interest expense | 9,686 | 8,914 | 38,278 | 32,217 | ||||||||||||
| (Earnings) loss in investment of unconsolidated joint venture1 | — | — | — | 147 | ||||||||||||
| Loss on extinguishment of debt | — | — | 72 | 2,176 | ||||||||||||
| Gain on sale of real estate | (10,534 | ) | — | (22,646 | ) | - | ||||||||||
| Appreciation (depreciation) of warrants2 | — | — | — | (1,760) | ||||||||||||
| Management fee revenue and other income | (30 | ) | (4 | ) | (88 | ) | (94) | |||||||||
| Net Operating Income | $ | 35,610 | $ | 33,090 | $ | 137,218 | $126,841 | |||||||||
| Earnings Before Interest, Taxes, Depreciation and Amortization for Real Estate (EBITDAre) |
| Net income (loss) | $ | 9,377 | $ | (3,536 | ) | $ | 13,807 | $ | (17,096 | ) | ||||||
| Depreciation and amortization | 22,793 | 23,553 | 92,891 | 95,312 | ||||||||||||
| Interest expense | 9,686 | 8,914 | 38,278 | 32,217 | ||||||||||||
| Loss on extinguishment of debt | — | — | 72 | 2,176 | ||||||||||||
| Gain on sale of real estate | (10,534 | ) | — | (22,646 | ) | — | ||||||||||
| Appreciation (depreciation) of warrants2 | — | — | — | (1,760 | ) | |||||||||||
| EBITDAre | $ | 31,322 | $ | 28,931 | $ | 122,402 | $ | 110,849 | ||||||||
| Stock compensation | 838 | 1,105 | 2,966 | 2,603 | ||||||||||||
| Acquisition expenses | — | — | 85 | 201 | ||||||||||||
| Pro forma effect of acquisitions/developments3 | 432 | 168 | 1,735 | 2,517 | ||||||||||||
| Adjusted EBITDA | $ | 32,592 | $ | 30,204 | $ | 127,188 | $ | 116,170 |
| Funds from Operations (FFO), Core FFO & Adjusted Funds from Operations (AFFO) |
| Net income (loss) | $ | 9,377 | $ | (3,536 | ) | $ | 13,807 | $ | (17,096 | ) | ||||||
| Gain on sale of real estate | (10,534 | ) | $ | — | (22,646 | ) | $ | — | ||||||||
| Depreciation and amortization | 22,793 | 23,553 | 92,891 | 95,312 | ||||||||||||
| Depreciation and amortization from unconsolidated joint venture | — | — | — | 268 | ||||||||||||
| FFO | $ | 21,636 | $ | 20,017 | $ | 84,052 | $ | 78,484 | ||||||||
| Preferred stock dividends | — | (917 | ) | (2,509 | ) | (4,866 | ) | |||||||||
| Acquisition expenses | — | — | 85 | 201 | ||||||||||||
| Appreciation (depreciation) of warrants2 | — | — | — | (1,760 | ) | |||||||||||
| Loss on extinguishment of debt | — | — | 72 | 2,176 | ||||||||||||
| Core FFO | $ | 21,636 | $ | 19,100 | $ | 81,700 | $ | 74,235 | ||||||||
| Amortization of debt related costs | 476 | 566 | 2,184 | 2,163 | ||||||||||||
| Non-cash interest expense | 582 | 666 | 984 | 2,248 | ||||||||||||
| Stock compensation | 838 | 1,105 | 2,966 | 2,603 | ||||||||||||
| Capitalized interest | (134 | ) | (604 | ) | (1,102 | ) | (1,125 | ) | ||||||||
| Straight line rent | (111 | ) | (637 | ) | (1,944 | ) | (3,682 | ) | ||||||||
| Above/below market lease rents | (401 | ) | (519 | ) | (2,221 | ) | (3,151 | ) | ||||||||
| Recurring capital expenditures4 | (880 | ) | (1,353 | ) | (5,743 | ) | (6,793 | ) | ||||||||
| AFFO | $ | 22,006 | $ | 18,324 | $ | 76,824 | $ | 66,498 | ||||||||
| Weighted-average common shares and units outstanding5 | 45,740 | 43,340 | 44,413 | 40,553 | ||||||||||||
| Core FFO attributable to common stockholders and unit holders per share | $ | 0.47 | $ | 0.44 | $ | 1.84 | $ | 1.83 | ||||||||
| AFFO attributable to common stockholders and unit holders per share | $ | 0.48 | $ | 0.42 | $ | 1.73 | $ | 1.64 | ||||||||
| 1) | Represents our share of (earnings) losses related to our investment in an unconsolidated joint venture. |
| 2) | Represents the change in the fair market value of our common stock warrants. On March 23, 2022, the common stock warrants were exercised in full and converted on a cashless basis, resulting in 139,940 shares of common stock. |
| 3) | Represents the estimated impact of wholly owned acquisitions and development properties as if they had been acquired or stabilized on the first day of each respective quarter in which the acquisitions occurred or developments were placed in-service. We have made a number of assumptions in such estimates and there can be no assurance that we would have generated the projected levels of EBITDA had we owned the acquired properties and/or placed the development properties in-service as of the beginning of the respective periods. |
| 4) | Excludes non-recurring capital expenditures of $6,181 and $17,390 for the three months ended December 31, 2023 and 2022, respectively, and $30,366 and $60,350 for the years ended December 31 2023 and 2022 respectively. |
| 5) | Weighted-average common shares and units outstanding includes common stock, OP units, and restricted stock units as of December 31, 2023 and excludes 51,410 performance stock units as they are deemed to be non-participatory. |
Page 8
| Plymouth Industrial REIT, Inc. |
| Consolidated Balance Sheets |
| Unaudited ($ in thousands) |
| December 31, 2023 | December 31, 2022 | |||||||
| ASSETS | ||||||||
| Real estate properties: | ||||||||
| Land | $ | 226,020 | $ | 231,829 | ||||
| Building and improvements | 1,341,846 | 1,324,017 | ||||||
| Less accumulated depreciation | (268,046 | ) | (205,629 | ) | ||||
| Total real estate properties, net | $ | 1,299,820 | $ | 1,350,217 | ||||
| Cash, cash held in escrow and restricted cash | 26,204 | 31,213 | ||||||
| Deferred lease intangibles, net | 51,474 | 70,718 | ||||||
| Interest rate swaps1 | 21,667 | 30,115 | ||||||
| Other assets | 42,734 | 39,055 | ||||||
| Total assets | $ | 1,441,899 | $ | 1,521,318 | ||||
| LIABILITIES, PREFERRED STOCK AND EQUITY | ||||||||
| Secured debt, net | $ | 266,887 | $ | 389,531 | ||||
| Unsecured debt, net2 | 603,390 | 524,845 | ||||||
| Interest rate swaps1 | 1,161 | — | ||||||
| Accounts payable, accrued expenses and other liabilities | 73,904 | 72,551 | ||||||
| Deferred lease intangibles, net | 6,044 | 8,918 | ||||||
| Financing lease liability3 | 2,271 | 2,248 | ||||||
| Total liabilities | $ | 953,657 | $ | 998,093 | ||||
| Preferred stock - Series A | $ | — | $ | 46,844 | ||||
| Equity: | ||||||||
| Common stock | $ | 452 | $ | 428 | ||||
| Additional paid in capital | 644,938 | 635,068 | ||||||
| Accumulated deficit | (182,606 | ) | (194,243 | ) | ||||
| Accumulated other comprehensive income | 20,233 | 29,739 | ||||||
| Total stockholders' equity | 483,017 | 470,992 | ||||||
| Non-controlling interest | 5,225 | 5,389 | ||||||
| Total equity | $ | 488,242 | $ | 476,381 | ||||
| Total liabilities, preferred stock and equity | $ | 1,441,899 | $ | 1,521,318 | ||||
| 1) | Represents the fair value of the Company's interest rate swaps. We minimize the credit risk in our derivative financial instruments by entering into transactions with various high-quality counterparties. Our exposure to credit risk at any point is generally limited to amounts recorded as assets on the accompanying consolidated balance sheets. A summary of the Company's interest rate swaps and accounting are detailed in Note 8 of our Annual Report on Form 10-K. |
| 2) | Includes borrowings under line of credit and term loans. Refer to Debt Summary in this Supplemental Information for additional details. |
| 3) | As of December 31, 2023, we have a single finance lease in which we are the sublessee for a ground lease with a remaining lease term of approximately 32 years. Refer to our 2023 Anual Report on Form 10-K for expanded disclosure. |
Page 9
| Plymouth Industrial REIT, Inc. |
| Capital Structure and Debt Summary |
| Unaudited ($ in thousands, except per-share amounts) as of 12/31/2023 |
| Debt Summary |
| Secured Debt: | Maturity Date | Interest Rate | Commitment | Principal Balance | |
| Ohio National Life Mortgage1 | August-24 | 4.14% | $ 21,000 | $ 18,409 | |
| Allianz Loan | April-26 | 4.07% | 63,115 | 61,260 | |
| Nationwide Loan | October-27 | 2.97% | 15,000 | 14,948 | |
| Lincoln Life Gateway Mortgage1 | January-28 | 3.43% | 28,800 | 28,800 | |
| Minnesota Life Memphis Industrial Loan1 | January-28 | 3.15% | 56,000 | 54,956 | |
| Midland National Life Insurance Mortgage1 | March-28 | 3.50% | 10,820 | 10,665 | |
| Minnesota Life Loan | May-28 | 3.78% | 21,500 | 19,569 | |
| Transamerica Loan | August-28 | 4.35% | 78,000 | 59,357 | |
| Total / Weighted Average Secured Debt | 3.77% | $ 294,235 | $ 267,964 | ||
| Unsecured Debt: | |||||
| KeyBank Line of Credit | August-25 | 6.62%2,3 | $ 350,000 | $ 155,400 | |
| $100m KeyBank Term Loan | August-26 | 3.10%2,3 | 100,000 | 100,000 | |
| $200m KeyBank Term Loan | February-27 | 3.13%2,3 | 200,000 | 200,000 | |
| $150m KeyBank Term Loan | May-27 | 4.50%2,3 | 150,000 | 150,000 | |
| Total / Weighted Average Unsecured Debt | 4.36% ` | $ 800,000 | $ 605,400 |
| December 31, | September 30, | June 30, | March 31, | December 31, | ||||||||||||||||
| Net Debt: | 2023 | 2023 | 2023 | 2023 | 2022 | |||||||||||||||
| Total Debt4 | $ | 873,364 | $ | 893,877 | $ | 925,033 | $ | 926,959 | $ | 918,728 | ||||||||||
| Less: Cash | 26,204 | 30,272 | 38,517 | 38,432 | 31,213 | |||||||||||||||
| Net Debt | $ | 847,160 | $ | 863,605 | $ | 886,516 | $ | 888,527 | $ | 887,515 | ||||||||||
| Capitalization |
| December 31, | September 30, | June 30, | March 31, | December 31, | ||||||||||||||||
| 2023 | 2023 | 2023 | 2023 | 2022 | ||||||||||||||||
| Common Shares and Units Outstanding5 | 45,740 | 45,740 | 43,591 | 43,521 | 43,339 | |||||||||||||||
| Closing Price (as of period end) | $ | 24.07 | $ | 20.95 | $ | 23.02 | $ | 21.01 | $ | 19.18 | ||||||||||
| Market Value of Common Shares6 | $ | 1,100,962 | $ | 958,253 | $ | 1,003,465 | $ | 914,376 | $ | 831,242 | ||||||||||
| Preferred Stock - Series A (at liquidation preference)8 | — | — | 48,845 | 48,845 | 48,888 | |||||||||||||||
| Total Market Capitalization6,7 | $ | 1,974,326 | $ | 1,852,130 | $ | 1,977,343 | $ | 1,890,180 | $ | 1,798,858 | ||||||||||
| Dividend / Share (annualized) | $ | 0.90 | $ | 0.90 | $ | 0.90 | $ | 0.90 | $ | 0.88 | ||||||||||
| Dividend Yield (annualized) | 3.7% | 4.3% | 3.9% | 4.3% | 4.6% | |||||||||||||||
| Total Debt-to-Total Market Capitalization | 44.2% | 48.3% | 46.8% | 49.0% | 51.1% | |||||||||||||||
| Secured Debt as a % of Total Debt | 30.7% | 42.4% | 41.9% | 42.0% | 42.6% | |||||||||||||||
| Unsecured Debt as a % of Total Debt | 69.3% | 57.6% | 58.1% | 58.0% | 57.4% | |||||||||||||||
| Net Debt-to-Annualized Adjusted EBITDA (quarter annualized) | 6.5 | x | 6.7 | x | 7.1 | x | 7.1 | x | 7.3 | x | ||||||||||
| Net Debt plus Preferred-to-Annualized Adjusted EBITDA (quarter annualized) | 6.5 | x | 6.7 | x | 7.4 | x | 7.5 | x | 7.7 | x | ||||||||||
| Weighted Average Maturity of Total Debt (years) | 3.0 | 3.0 | 3.2 | 3.4 | 3.7 | |||||||||||||||
| Capital Markets Activity |
| Common Shares | Avg. Price | Offering | Period | Net Proceeds | ||||||||
| — | $ | — | N/A | Q1 2023 | $ | — | ||||||
| 70,000 | $ | 23.16 | ATM | Q2 2023 | $ | 1,385 | ||||||
| 2,130,600 | $ | 23.04 | ATM | Q3 2023 | $ | 48,133 | ||||||
| — | $ | — | N/A | Q4 2023 | $ | — | ||||||
| Refer to Glossary in this Supplemental Information for definitions of non-GAAP financial measures, including Net debt and Net debt plus preferred-to-Adjusted EBITDA. |
| 1) | Debt assumed at acquisition. |
| 2) | For the month of December 2023, the one-month term SOFR for our unsecured debt was 5.345% and the one-month term SOFR for our borrowings under line of credit was at a weighted average of 5.350%. The spread over the applicable rate for the $100m, $150m, and $200m KeyBank Term Loans and KeyBank unsecured line of credit is based on the Company’s total leverage ratio plus the 0.1% SOFR index adjustment. |
| 3) | As of December 31, 2023, the one-month term SOFR for the $100m, $150m and $200m KeyBank Term Loans was swapped to a fixed rate of 1.504%, 2.904%, 1.527% respectively. As of December 31, 2023, $100m of the outstanding borrowings under the KeyBank unsecured line of credit was swapped to a fixed USD-SOFR rate at a weighted average of 4.754%. |
| 4) | Total Debt is not adjusted for the amortization of debt issuance costs or fair market premiums or discounts. |
| 5) | Common shares and units outstanding were 45,250 and 490 as of December 31, 2023, respectively, and 36,111 and 490 for the year ended December 31, 2022, respectively. |
| 6) | Based on closing price as of last trading day of the quarter and common shares and units as of the period ended. |
| 7) | Market value of shares and units plus total debt and preferred stock as of period end. |
| 8) | On September 6, 2023 ("Redemption Date"), the Company redeemed all outstanding Series A Preferred Stock in cash at a redemption price equal to $25.00 per share. As of the Redemption Date and through December 31, 2023, the shares of Series A Preferred Stock were no longer outstanding. |
Page 10
| Plymouth Industrial REIT, Inc. | |
| Net Asset Value Components | |
| Unaudited ($ in thousands) as of 12/31/2023 | |
| Net Operating Income | Developable Land | |||||||||
| Three Months | ||||||||||
| Ended | Owned | Developable | Under | Est. Investment / | Under | |||||
| December 31, 2023 | Market | Land (acres)4 | GLA (SF)4 | Construction (SF)5 | Est. Completion | Development (SF)5 | ||||
| Pro Forma Net Operating Income (NOI) | Atlanta | 9 | 200,000 | |||||||
| Total Operating NOI | $ 35,610 | Chicago | 11 | 220,000 | ||||||
| Pro Forma Effect of New Lease Activity1 | 507 | Cincinnati | 18 | 285,308 | 285,308 | |||||
| Pro Forma Effect of Acquisitions2 | - | Jacksonville | 12 | 95,587 | 52,920 | $7.4M/Mid-'24 | 42,667 | |||
| Pro Forma Effect of Repositioning / Development3 | 641 | Memphis | 23 | 475,000 | ||||||
| Pro Forma NOI | $ 36,758 | St. Louis | 31 | 300,000 | ||||||
| Charlotte | 6 | 100,000 | ||||||||
| Amortization of above / below market lease intangibles, net | (401) | 110 | 1,675,895 | 52,920 | 327,975 | |||||
| Straight-line rental revenue adjustment | (111) | |||||||||
| Pro Forma Cash NOI | $ 36,246 | |||||||||
| Other Assets and Liabilities | |||
| Cash, cash held in escrow and restricted cash | $ 26,204 | ||
| Other assets | $ 42,734 | ||
| CIP related to development properties | $ 3,575 | ||
| Accounts payable, accrued expenses and other liabilities | $ 73,904 | ||
| Debt and Preferred Stock | |||
| Secured Debt | $ 267,964 | ||
| Unsecured Debt | $ 605,400 | ||
| Common shares and units outstanding6 | 45,740 | ||
| We have made a number of assumptions with respect to the pro forma effects and there can be no assurance that we would have generated the projected levels of NOI had we actually owned the acquired properties and / or fully stabilized the repositioning / development properties as of the beginning of the period. Refer to Glossary in this Supplemental Information for a definition and discussion of non-GAAP financial measures. |
| 1) | Represents the estimated incremental base rents from uncommenced new leases as if rent commencement had occurred as of the beginning of the period. |
| 2) | Represents the estimated impact of acquisitions as if they had been acquired at the beginning of the period. |
| 3) | Represents the estimated impact of properties that are undergoing repositioning or lease-up and development properties placed in-service as if the properties were stabilized and rents had commenced as of the beginning of the period. |
| 4) | Developable land represents acreage currently owned by us and identified for potential development. The developable gross leasable area (GLA) is based on the developable land area and a land to building ratio. Developable land and GLA are estimated and can change periodically due to changes in site design, road and storm water requirements, parking requirements and other factors. We have made a number of assumptions in such estimates and there can be no assurance that we will develop land that we own. |
| 5) | Under construction represents projects for which vertical construction has commenced. Under development represents projects in the pre-construction phase. |
| 6) | Common shares and units outstanding were 45,250 and 490, respectively, as of December 31, 2023. |
Page 11
| Plymouth Industrial REIT, Inc. | |
| Leasing Activity | |
| Unaudited as of 12/31/2023 | |
| Lease Renewals and New Leases1 |
| Year | Type | Square Footage | Percent | Expiring Rent | New Rent | % Change | Tenant Improvements $/SF/YR |
Lease Commissions $/SF/YR |
| 2020 | Renewals | 1,881,346 | 71.1% | $ 3.75 | $ 3.93 | 4.8% | $ 0.13 | $ 0.08 |
| New Leases | 764,314 | 28.9% | $ 4.31 | $ 5.07 | 17.6% | $ 0.24 | $ 0.19 | |
| Total | 2,645,660 | 100% | $ 3.92 | $ 4.26 | 8.7% | $ 0.16 | $ 0.11 | |
| 2021 | Renewals | 2,487,589 | 49.3% | $ 4.25 | $ 4.50 | 5.9% | $ 0.19 | $ 0.10 |
| New Leases | 2,557,312 | 50.7% | $ 3.76 | $ 4.40 | 17.0% | $ 0.23 | $ 0.22 | |
| Total | 5,044,901 | 100% | $ 4.00 | $ 4.45 | 11.1% | $ 0.21 | $ 0.16 | |
| 2022 | Renewals | 4,602,355 | 60.2% | $ 4.31 | $ 4.87 | 13.1% | $ 0.15 | $ 0.16 |
| New Leases | 3,041,526 | 39.8% | $ 3.51 | $ 4.51 | 28.6% | $ 0.40 | $ 0.23 | |
| Total | 7,643,881 | 100% | $ 3.99 | $ 4.73 | 18.5% | $ 0.25 | $ 0.19 | |
| Q1 2023 | Renewals | 645,885 | 84.0% | $ 4.62 | $ 5.16 | 11.7% | $ 0.14 | $ 0.15 |
| New Leases | 123,081 | 16.0% | $ 4.56 | $ 6.29 | 37.9% | $ 0.69 | $ 0.27 | |
| Total | 768,966 | 100% | $ 4.61 | $ 5.34 | 15.9% | $ 0.23 | $ 0.17 | |
| Q2 2023 | Renewals | 1,440,165 | 68.5% | $ 3.47 | $ 3.86 | 11.2% | $ 0.09 | $ 0.10 |
| New Leases | 662,930 | 31.5% | $ 3.61 | $ 4.92 | 36.0% | $ 0.19 | $ 0.37 | |
| Total | 2,103,095 | 100% | $ 3.52 | $ 4.20 | 19.3% | $ 0.12 | $ 0.17 | |
| Q3 2023 | Renewals | 1,194,817 | 67.8% | $ 3.65 | $ 4.51 | 23.6% | $ 0.12 | $ 0.18 |
| New Leases | 566,898 | 32.2% | $ 3.75 | $ 4.72 | 25.9% | $ 0.43 | $ 0.37 | |
| Total | 1,761,715 | 100% | $ 3.69 | $ 4.58 | 24.1% | $ 0.25 | $ 0.26 | |
| Q4 2023 | Renewals | 664,157 | 68.7% | $ 3.69 | $ 4.41 | 19.5% | $ 0.22 | $ 0.21 |
| New Leases | 302,010 | 31.3% | $ 4.07 | $ 5.35 | 31.4% | $ 0.36 | $ 0.29 | |
| Total | 966,167 | 100% | $ 3.81 | $ 4.70 | 23.4% | $ 0.25 | $ 0.23 | |
| Total 20232 | Renewals | 3,945,024 | 70.4% | $ 3.75 | $ 4.36 | 16.3% | $ 0.14 | $ 0.15 |
| New Leases | 1,654,919 | 29.6% | $ 3.82 | $ 5.03 | 31.7% | $ 0.35 | $ 0.35 | |
| Total | 5,599,943 | 100% | $ 3.77 | $ 4.56 | 21.0% | $ 0.21 | $ 0.21 |
| Lease Expiration Schedule |
| Year | Square Footage | ABR3 | % of ABR Expiring4 | 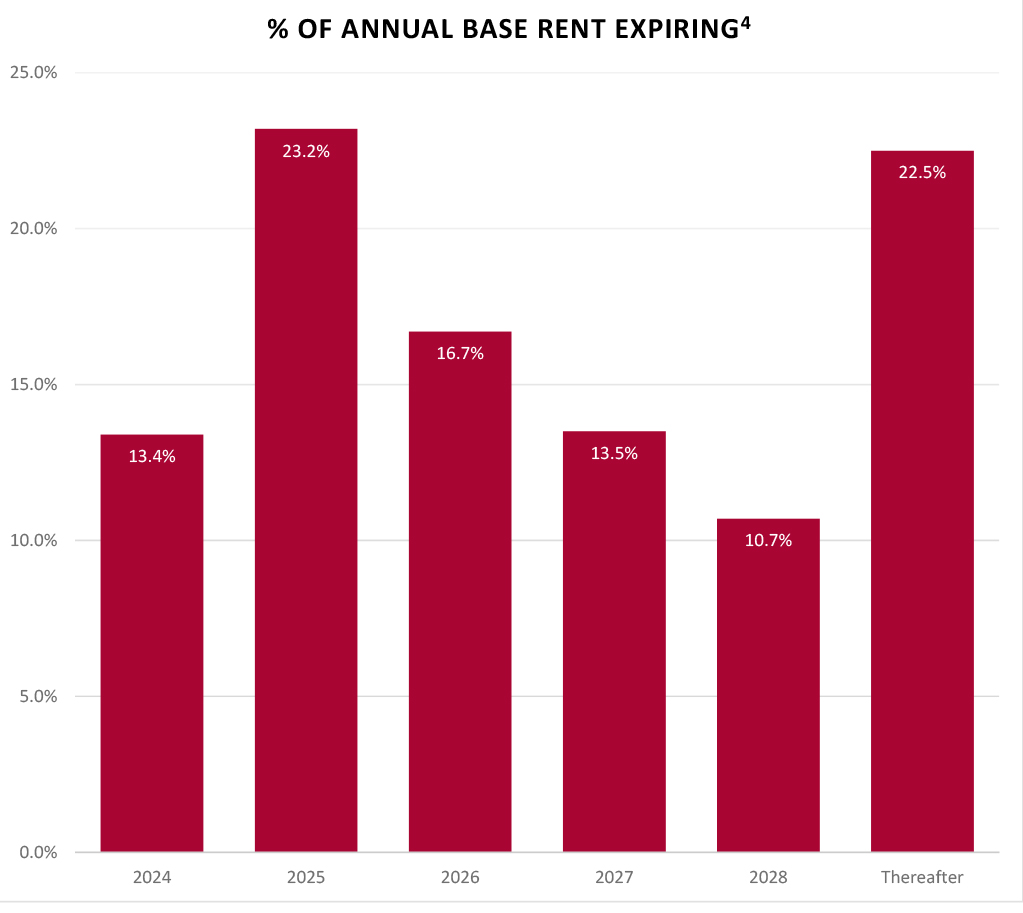 | |||||
| Available | 659,424 | $ - | - | ||||||
| 2024 | 4,580,860 | 20,209,068 | 13.4% | ||||||
| 2025 | 7,914,431 | 35,008,462 | 23.2% | ||||||
| 2026 | 5,310,169 | 25,270,933 | 16.7% | ||||||
| 2027 | 4,422,175 | 20,397,378 | 13.5% | ||||||
| 2028 | 3,638,154 | 16,117,289 | 10.7% | ||||||
| Thereafter | 7,499,888 | 33,744,180 | 22.5% | ||||||
| Total | 34,025,101 | $ 150,747,310 | 100% | ||||||
| 1) | Lease renewals and new lease activity excludes leases with terms less than six months. |
| 2) | Executed leases scheduled to commence during 2023, excluding leases associated with new construction, total an aggregate of 5,599,943 square feet, all of which are associated with terms of at least six months. The Company will experience a 21.0% increase in rental rates on a cash basis from these leases. |
| 3) | Annualized base rent is calculated as monthly contracted base rent as of December 31, 2023, multiplied by 12. Excludes rent abatements. |
| 4) | Calculated as annualized base rent set forth in this table divided by total annualized base rent as of December 31, 2023. |
Page 12
| Plymouth Industrial REIT, Inc. | |||||||
| Leased Square Feet and Annualized Base Rent by Tenant Industry | |||||||
| Unaudited as of 12/31/2023 | |||||||
| Industry | Total Leased Square Feet |
# of Leases | % Rentable Square Feet |
ABR1 | % ABR | ABR Per Square Foot |
| Logistics & Transportation | 9,856,430 | 86 | 29.5% | $ 40,658,335 | 27.0% | $ 4.13 |
| Wholesale/Retail | 2,239,538 | 28 | 6.7% | 11,418,223 | 7.6% | 5.10 |
| Automotive | 2,192,860 | 26 | 6.6% | 9,884,416 | 6.6% | 4.51 |
| Printing & Paper | 1,935,478 | 15 | 5.8% | 7,332,446 | 4.9% | 3.79 |
| Home & Garden | 1,972,186 | 20 | 5.9% | 6,813,922 | 4.5% | 3.46 |
| Construction | 1,784,318 | 41 | 5.3% | 8,072,615 | 5.4% | 4.52 |
| Cardboard and Packaging | 1,630,027 | 20 | 4.9% | 6,688,586 | 4.4% | 4.10 |
| Food & Beverage | 1,568,810 | 22 | 4.7% | 7,956,872 | 5.3% | 5.07 |
| Light Manufacturing | 1,234,493 | 12 | 3.7% | 4,490,559 | 3.0% | 3.64 |
| Healthcare | 1,017,495 | 39 | 3.0% | 6,146,387 | 4.1% | 6.04 |
| Other Industries* | 7,934,042 | 201 | 23.9% | 41,284,949 | 27.2% | 5.20 |
| Total | 33,365,677 | 510 | 100.0% | $ 150,747,310 | 100.0% | $ 4.52 |
| *Other Industries | Total Leased Square Feet |
# of Leases | % Rentable Square Feet |
ABR1 | % ABR | ABR Per Square Foot |
| Plastics | 939,728 | 13 | 2.8% | $ 4,417,624 | 2.9% | $ 4.70 |
| Education | 925,840 | 8 | 2.8% | 4,464,571 | 3.0% | 4.82 |
| Industrial Equipment Components | 858,930 | 24 | 2.6% | 4,110,749 | 2.7% | 4.79 |
| Metal Fabrication/Finishing | 639,114 | 10 | 1.9% | 3,176,681 | 2.1% | 4.97 |
| Technology & Electronics | 525,661 | 21 | 1.6% | 3,558,481 | 2.4% | 6.77 |
| Chemical | 520,132 | 8 | 1.6% | 2,024,581 | 1.3% | 3.89 |
| Storage | 520,540 | 10 | 1.6% | 2,934,367 | 1.9% | 5.64 |
| Aero Space | 455,605 | 3 | 1.4% | 1,446,498 | 1.0% | 3.17 |
| Business Services | 408,606 | 24 | 1.2% | 3,302,769 | 2.2% | 8.08 |
| Plumbing Equipment/Services | 404,712 | 7 | 1.2% | 1,585,498 | 1.0% | 3.92 |
| Other2 | 1,735,174 | 73 | 5.2% | 10,263,130 | 6.7% | 5.91 |
| Total | 7,934,042 | 201 | 23.9% | $ 41,284,949 | 27.2% | $ 5.20 |
| 1) | Annualized base rent is calculated as monthly contracted base rent as of December 31, 2023, multiplied by 12. Excludes rent abatements. |
| 2) | Includes tenant industries for which the total leased square feet aggregates to less than 300,000 square feet. |
Page 13
| Plymouth Industrial REIT, Inc. | ||||||||
| Leased Square Feet and Annualized Base Rent by Type | ||||||||
| Unaudited as of 12/31/2023 | ||||||||
| Leased Square Feet and Annualized Base Rent by Lease Type |
| Lease Type | Total Leased Square Feet |
# of Leases |
% Leased Square Feet |
ABR1 | % ABR | ABR Per Square Foot | |
| Triple Net | 27,714,431 | 402 | 83.1% | $ 122,117,615 | 81.0% | $ 4.41 | |
| Modified Net | 3,701,020 | 63 | 11.1% | 18,979,517 | 12.6% | 5.13 | |
| Gross | 1,950,226 | 45 | 5.8% | 9,650,178 | 6.4% | 4.95 | |
| Total | 33,365,677 | 510 | 100.0% | $ 150,747,310 | 100.0% | $ 4.52 |
| Leased Square Feet and Annualized Base Rent by Tenant Type |
| Tenant Type | Total Leased Square Feet |
# of Leases |
% Leased Square Feet | ABR1 | % ABR | ABR Per Square Foot | |
| Multi-Tenant | 16,821,120 | 405 | 50.4% | $ 82,322,082 | 54.6% | $ 4.89 | |
| Single-Tenant | 16,544,557 | 105 | 49.6% | 68,425,228 | 45.4% | 4.14 | |
| Total | 33,365,677 | 510 | 100.0% | $ 150,747,310 | 100.0% | $ 4.52 |
| Leased Square Feet and Annualized Base Rent by Building Type |
| Building Type | Total Leased Square Feet |
# of Buildings |
% Leased Square Feet |
ABR1 | % ABR | ABR Per Square Foot | |
| Warehouse/Distribution | 21,313,056 | 118 | 63.8% | $ 84,902,285 | 56.3% | $ 3.98 | |
| Warehouse/Light Manufacturing | 8,662,758 | 41 | 26.0% | 39,790,739 | 26.4% | 4.59 | |
| Small Bay Industrial2 | 3,389,863 | 52 | 10.2% | 26,054,286 | 17.3% | 7.69 | |
| Total | 33,365,677 | 211 | 100.0% | $ 150,747,310 | 100.0% | $ 4.52 | |
| 1) | Annualized base rent is calculated as monthly contracted base rent as of December 31, 2023, multiplied by 12. Excludes rent abatements. |
| 2) | Small bay industrial is inclusive of flex space totaling 594,134 leased square feet and annualized base rent of $6,930,211. Small bay industrial is multipurpose space; flex space includes office space that accounts for greater than 50% of the total rentable area. |
Page 14
| Plymouth Industrial REIT, Inc. | ||
| Top 10 Tenants by Annualized Base Rent | ||
| Unaudited as of 12/31/2023 | ||
| Tenant | Market | Industry | # of Leases |
Total Leased Square Feet |
Expiration | ABR Per Square Foot |
ABR1 | % Total ABR |
| FedEx Supply Chain, Inc. | St. Louis | Logistics & Transportation | 1 | 769,500 | 7/31/2024 | $ 4.60 | $ 3,539,875 | 2.3% |
| Geodis Logistics, LLC | St. Louis | Logistics & Transportation | 1 | 624,159 | 8/31/2025 | 4.36 | 2,718,993 | 1.8% |
| Royal Canin U.S.A, Inc. | St. Louis | Wholesale/Retail | 1 | 521,171 | 12/31/2025 | 4.89 | 2,549,829 | 1.7% |
| Houghton Mifflin Harcourt Company | Chicago | Education | 1 | 513,512 | 3/31/2026 | 4.56 | 2,341,615 | 1.6% |
| ODW Logistics, Inc. | Columbus | Logistics & Transportation | 1 | 772,450 | 6/30/2025 | 2.99 | 2,312,163 | 1.5% |
| Archway Marketing Holdings, Inc. | Chicago | Logistics & Transportation | 3 | 503,000 | 3/31/2026 | 4.51 | 2,268,180 | 1.5% |
| ASW Supply Chain Services, LLC5 | Cleveland | Logistics & Transportation | 5 | 577,237 | 11/30/2027 | 3.67 | 2,118,373 | 1.4% |
| Balta US, Inc. | Jacksonville | Home & Garden | 2 | 629,084 | 10/31/2029 | 3.13 | 1,968,631 | 1.3% |
| Communications Test Design, Inc. | Memphis | Logistics & Transportation | 2 | 566,281 | 12/31/2024 | 3.34 | 1,892,967 | 1.3% |
| Winston Products, LLC | Cleveland | Wholesale/Retail | 2 | 266,803 | 4/30/2032 | 6.94 | 1,852,295 | 1.2% |
| Total Largest Tenants by Annualized Rent | 19 | 5,743,197 | $ 4.10 | $ 23,562,921 | 15.6% | |||
| All Other Tenants | 491 | 27,622,480 | $ 4.60 | $ 127,184,389 | 84.4% | |||
| Total Company Portfolio | 510 | 33,365,677 | $ 4.52 | $ 150,747,310 | 100.0% | |||
| Lease Segmentation by Size |
| Square Feet | # of Leases | Total Leased Square Feet |
Total Rentable Square Feet |
Total Leased % |
Total Leased % Excluding Repositioning2 |
ABR1 | In-Place + Uncommenced ABR3 | % of Total In-Place + Uncommenced ABR | In-Place + Uncommenced ABR Per SF4 |
| < 4,999 | 62 | 180,664 | 239,711 | 75.4% | 77.3% | $ 1,721,169 | $ 1,725,141 | 1.1% | $ 9.49 |
| 5,000 - 9,999 | 73 | 515,051 | 608,271 | 84.7% | 84.9% | 4,479,521 | 4,479,521 | 3.0% | 8.70 |
| 10,000 - 24,999 | 113 | 1,924,595 | 1,961,546 | 98.1% | 98.0% | 14,185,854 | 14,185,854 | 9.4% | 7.37 |
| 25,000 - 49,999 | 91 | 3,230,594 | 3,339,711 | 96.7% | 96.7% | 18,781,921 | 18,781,921 | 12.5% | 5.81 |
| 50,000 - 99,999 | 77 | 5,391,983 | 5,530,500 | 97.5% | 97.5% | 24,574,958 | 24,574,958 | 16.3% | 4.56 |
| 100,000 - 249,999 | 64 | 10,405,372 | 10,627,944 | 97.9% | 97.9% | 44,389,989 | 44,389,989 | 29.4% | 4.27 |
| > 250,000 | 30 | 11,717,418 | 11,717,418 | 100.0% | 100.0% | 42,613,898 | 42,613,898 | 28.3% | 3.64 |
| Total / Weighted Average | 510 | 33,365,677 | 34,025,101 | 98.1% | 98.1% | $ 150,747,310 | $ 150,751,282 | 100.0% | $ 4.52 |
| 1) | Annualized base rent is calculated as monthly contracted base rent as of December 31, 2023, multiplied by 12. Excludes rent abatements. |
| 2) | Total Leased % Excluding Repositioning excludes vacant square footage being refurbished or repositioned. |
| 3) | In-Place + Uncommenced ABR calculated as in-place current annualized base rent as of December 31, 2023 plus annualized base rent for leases signed but not commenced as of December 31, 2023. |
| 4) | In-Place + Uncommenced ABR per SF is calculated as in-place current rent annualized base rent as of December 31, 2023 plus annualized base rent for leases signed but not commenced as of December 31, 2023, divided by leased square feet plus uncommenced leased square feet. |
| 5) | Inclusive of a single 44,800 square feet lease expired on December 31, 2023. The remaining balance of the square footage has an expiration date of November 30, 2027. |
Page 15
| Plymouth Industrial REIT, Inc. |
| Rentable Square Feet and Annualized Base Rent by Market |
| Unaudited ($ in thousands) as of 12/31/2023 |
| Primary Markets1 | ||||||||
| Total Rentable | % Rentable | |||||||
| # of Properties | # of Buildings | Occupancy | Square Feet | Square Feet | ABR2 | % ABR | ||
| Atlanta3 | 11 | 13 | 99.9% | 2,086,835 | 6.1% | $ 9,754 | 6.5% | |
| Chicago | 39 | 40 | 99.6% | 6,624,335 | 19.5% | 30,279 | 20.1% | |
| Secondary Markets1 | ||||||||
| Total Rentable | % Rentable | |||||||
| # of Properties | # of Buildings | Occupancy | Square Feet | Square Feet | ABR2 | % ABR | ||
| Boston | 1 | 2 | 100.0% | 268,713 | 0.8% | $ 2,119 | 1.4% | |
| Charlotte | 1 | 1 | 100.0% | 155,220 | 0.5% | 1,229 | 0.8% | |
| Cincinnati3 | 10 | 12 | 95.0% | 2,710,964 | 8.0% | 10,817 | 7.2% | |
| Cleveland | 16 | 19 | 98.6% | 3,979,209 | 11.7% | 18,555 | 12.3% | |
| Columbus | 15 | 15 | 100.0% | 3,757,614 | 11.0% | 13,629 | 9.0% | |
| Indianapolis | 17 | 17 | 95.6% | 4,085,169 | 12.0% | 15,140 | 10.0% | |
| Jacksonville3 | 8 | 28 | 99.6% | 2,132,396 | 6.3% | 15,596 | 10.4% | |
| Kansas City | 1 | 1 | 69.1% | 221,911 | 0.6% | 558 | 0.4% | |
| Memphis | 25 | 49 | 96.6% | 4,783,046 | 14.1% | 17,858 | 11.8% | |
| St. Louis | 12 | 14 | 99.4% | 3,219,689 | 9.4% | 15,213 | 10.1% | |
| Total | 156 | 211 | 98.1% | 34,025,101 | 100.0% | $ 150,747 | 100.0% | |
| Total Acquisition and Replacement Cost by Market |
| Market | State | # of Buildings | Total Acquisition Cost4 |
Gross Real Estate Assets5 |
% Gross Real Estate Assets |
Replacement Cost6 | |
| Atlanta | GA | 13 | $ 111,988 | $ 107,964 | 6.9% | $ 154,583 | |
| Chicago | IL, IN, WI | 40 | 279,750 | 275,312 | 17.7% | 710,499 | |
| Boston | ME | 2 | 19,023 | 19,275 | 1.2% | 40,729 | |
| Charlotte | NC | 1 | 20,400 | 18,999 | 1.2% | 20,821 | |
| Cincinnati | OH, KY | 12 | 106,705 | 109,975 | 7.1% | 190,851 | |
| Cleveland | OH | 19 | 201,550 | 190,839 | 12.3% | 362,436 | |
| Columbus | OH | 15 | 157,624 | 149,170 | 9.6% | 293,943 | |
| Indianapolis | IN | 17 | 149,251 | 141,927 | 9.1% | 356,416 | |
| Jacksonville | FL, GA | 28 | 159,621 | 149,102 | 9.6% | 219,679 | |
| Kansas City | MO | 1 | 8,600 | 9,057 | 0.6% | 20,451 | |
| Memphis | MS, TN | 49 | 185,407 | 183,830 | 11.8% | 349,852 | |
| St. Louis | IL, MO | 14 | 213,787 | 201,208 | 12.9% | 325,818 | |
| Total | 211 | $ 1,613,706 | $ 1,556,658 | 100.0% | $ 3,046,078 | ||
| 1) | Primary markets means the following two metropolitan areas in the U.S., each generally consisting of more than 300 million square feet of industrial space: Chicago and Atlanta. Secondary markets means non-primary markets, each generally consisting of between 100 million and 300 million square feet of industrial space, including the following metropolitan areas in the U.S.: Boston, Charlotte, Cincinnati, Cleveland, Columbus, Indianapolis, Jacksonville, Kansas City, Memphis, Milwaukee, South Florida, and St. Louis. Our definitions of primary and secondary markets may vary from the definitions of these terms used by investors, analysts, or other industrial REITs. |
| 2) | Annualized base rent is calculated as monthly contracted base rent as of December 31, 2023, multiplied by 12. Excludes rent abatements. |
| 3) | During Q1 2023, the 154,692 square feet development property in Cincinnati was placed in-service. During Q3 2023, the 40,572 and 180,000 square feet development properties in Jacksonville and Atlanta, respectively, were placed in-service. During Q4 2023, the 39,750 square feet devlopment property in Jacksonville was placed in-service. |
| 4) | Represents total direct consideration paid prior to the allocations per U.S. GAAP and the allocated costs in accordance to GAAP of development properties placed in-service. |
| 5) | The gross book value of real estate assets as of December 31, 2023 excludes development projects of $3,412, $2,456 in leasehold improvements and assets related to corporate activities, our regional property management office in Columbus of $4,495, and the finance lease right-of-use asset of $845 related to the ground sublease at 2100 International Parkway. Gross book value of real estate assets excludes depreciation and the allocation of the acquisition cost related to intangible assets and liabilities required by U.S. GAAP. |
| 6) | Replacement cost is based on the Marshall & Swift valuation methodology for the determination of building costs. Replacement cost includes land reflected at the allocated cost in accordance with GAAP. |
Page 16
| Plymouth Industrial REIT, Inc. |
| Glossary |
| This glossary contains additional details for sections throughout this Supplemental Information, including explanations and reconciliations of certain non-GAAP financial measures, and the reasons why we use these supplemental measures of performance and believe they provide useful information to investors. Additional detail can be found in our most recent annual report on Form 10-K and subsequent quarterly reports on Form 10-Q, as well as other documents filed with or furnished to the SEC from time to time. | |||||
| Non-GAAP Financial Measures Definitions: | |||||
| Net Operating Income (NOI): We consider net operating income, or NOI, to be an appropriate supplemental measure to net income in that it helps both investors and management understand the core operations of our properties. We define NOI as total revenue (including rental revenue and tenant reimbursements) less property-level operating expenses. NOI excludes depreciation and amortization, general and administrative expenses, impairments, gain/loss on sale of real estate, interest expense, and other non-operating items. | |||||
| Cash Net Operating Income - (Cash NOI): We define Cash NOI as NOI excluding straight-line rent adjustments and amortization of above and below market leases. | |||||
| EBITDAre and Adjusted EBITDA: We define earnings before interest, taxes, depreciation and amortization for real estate in accordance with the standards established by the National Association of Real Estate Investment Trusts (“NAREIT”). EBITDAre represents net income (loss), computed in accordance with GAAP, before interest expense, tax, depreciation and amortization, gains or losses on the sale of rental property, appreciation/(depreciation) of warrants, loss on impairments, and loss on extinguishment of debt. We calculate Adjusted EBITDA by adding or subtracting from EBITDAre the following items: (i) non-cash stock compensation, (ii) loss on extinguishment of debt, (iii) acquisition expenses (iv) the proforma impacts of acquisition, dispositions and developments and (v) non-cash impairments on real estate lease. We believe that EBITDAre and Adjusted EBITDA are helpful to investors as supplemental measures of our operating performance as a real estate company as they are direct measures of the actual operating results of our industrial properties. EBITDAre and Adjusted EBITDA should not be used as measures of our liquidity and may not be comparable to how other REITs' calculate EBITDAre and Adjusted EBITDA. | |||||
| Funds From Operations ("FFO"): Funds from operations, or FFO, is a non-GAAP financial measure that is widely recognized as a measure of an REIT’s operating performance, thereby, providing investors the potential to compare our operating performance with that of other REITs. We consider FFO to be an appropriate supplemental measure of our operating performance as it is based on a net income analysis of property portfolio performance that excludes non-cash items such as depreciation. The historical accounting convention used for real estate assets requires straight-line depreciation of buildings and improvements, which implies that the value of real estate assets diminishes predictably over time. Since real estate values rise and fall with market conditions, presentations of operating results for a REIT, using historical accounting for depreciation, could be less informative. In December 2018, NAREIT issued a white paper restating the definition of FFO. The purpose of the restatement was not to change the fundamental definition of FFO, but to clarify existing NAREIT guidance. The restated definition of FFO is as follows: Net Income (calculated in accordance with GAAP), excluding: (i) Depreciation and amortization related to real estate, (ii) Gains and losses from the sale of certain real estate assets, (iii) Gain and losses from change in control, and (iv) Impairment write-downs of certain real estate assets and investments in entities when the impairment is directly attributable to decreases in the value of depreciable real estate held by the entity. We define FFO, consistent with the NAREIT definition. Adjustments for unconsolidated partnerships and joint ventures will be calculated to reflect FFO on the same basis. Other equity REITs may not calculate FFO as we do, and, accordingly, our FFO may not be comparable to such other REITs’ FFO. FFO should not be used as a measure of our liquidity and is not indicative of funds available for our cash needs, including our ability to pay dividends. | |||||
| Core Funds from Operations (“Core FFO”): We calculate Core FFO by adjusting FFO for non-comparable items such as dividends paid (or declared) to holders of our preferred stock, acquisition and transaction related expenses for transactions not completed, and certain non-cash operating expenses such as impairment on real estate lease, appreciation/(depreciation) of warrants and loss on extinguishment of debt. We believe that Core FFO is a useful supplemental measure in addition to FFO by adjusting for items that are not considered by us to be part of the period over period operating performance of our property portfolio, thereby, providing a more meaningful and consistent comparison of our operating and financial performance during the periods presented. As with FFO, our reported Core FFO may not be comparable to other REITs’ Core FFO, should not be used as a measure of our liquidity, and is not indicative of our funds available for our cash needs, including our ability to pay dividends. | |||||
| Adjusted Funds from Operations attributable to common stockholders (“AFFO”): Adjusted funds from operations, or AFFO, is presented in addition to Core FFO. AFFO is defined as Core FFO, excluding certain non-cash operating revenues and expenses, capitalized interest and recurring capitalized expenditures. Recurring capitalized expenditures include expenditures required to maintain and re-tenant our properties, tenant improvements and leasing commissions. AFFO further adjusts Core FFOfor certain other non-cash items, including the amortization or accretion of above or below market rents included in revenues, straight line rent adjustments, non-cash equity compensation and non-cash interest expense. We believe AFFO provides a useful supplemental measure of our operating performance because it provides a consistent comparison of our operating performance across time periods that is comparable for each type of real estate investment and is consistent with management's analysis of the operating performance of our properties. As a result, we believe that the use of AFFO, together with the required GAAP presentations, provide a more complete understanding of our operating performance. As with Core FFO, our reported AFFO may not be comparable to other REITs’ AFFO, should not be used as a measure of our liquidity, and is not indicative of our funds available for our cash needs, including our ability to pay dividends. |
|||||
| Net Debt and Preferred Stock to Adjusted EBITDA: Net debt and preferred stock to Adjusted EBITDA is a non-GAAP financial measure that we believe is useful to investors as a supplemental measure in evaluating balance sheet leverage. Net debt and preferred stock is equal to the sum of total consolidated and our pro rata share of unconsolidated joint venture debt less cash, cash equivalents, and restricted cash, plus preferred stock calculated at its liquidation preference as of the end of the period. | |||||
Page 17
| Plymouth Industrial REIT, Inc. |
| Glossary |
| This glossary contains additional details for sections throughout this Supplemental Information, including explanations and reconciliations of certain non-GAAP financial measures, and the reasons why we use these supplemental measures of performance and believe they provide useful information to investors. Additional detail can be found in our most recent annual report on Form 10-K and subsequent quarterly reports on Form 10-Q, as well as other documents filed with or furnished to the SEC from time to time. |
| Other Definitions: | |||||||||||||
| GAAP: U.S. generally accepted accounting principles. | |||||||||||||
| Lease Type: We define our triple net leases in that the tenant is responsible for all aspects of and costs related to the property and its operation during the lease term. We define our modified net leases in that the landlord is responsible for some property related expenses during the lease term, but the cost of most of the expenses is passed through to the tenant. We define our gross leases in that the landlord is responsible for all aspects of and costs related to the property and its operation during the lease term. | |||||||||||||
| Non-Recurring Capital Expenditures: Non-recurring capital expenditures include capital expenditures of long lived improvements required to upgrade/replace existing systems or items that previously did not exist. Non-recurring capital expenditures also include costs associated with repositioning a property, redevelopment/development and capital improvements known at the time of acquisition. | |||||||||||||
| Occupancy: We define occupancy as the percentage of total leasable square footage as the earlier of lease term commencement or revenue recognition in accordance to GAAP as of the close of the reporting period. | |||||||||||||
| Recurring Capital Expenditures: Recurring capitalized expenditures includes capital expenditures required to maintain and re-tenant our buildings, tenant improvements and leasing commissions. | |||||||||||||
| Replacement Cost: is based on the Marshall & Swift valuation methodology for the determination of building costs. The Marshall & Swift building cost data and analysis is widely recognized within the U.S. legal system and has been written into in law in over 30 U.S. states and recognized in the U.S. Treasury Department Internal Revenue Service Publication. Replacement cost includes land reflected at the allocated cost in accordance with Financial Accounting Standards Board ("FASB") ASC 805. | |||||||||||||
| Same Store Portfolio: The Same Store Portfolio is a subset of the consolidated portfolio and includes properties that are wholly owned by the Company as of December 31, 2021. The Same Store Portfolio is evaluated and defined on an annual basis based on the growth and size of the consolidated portfolio. The Same Store Portfolio excludes properties that are classified as repositioning, lease-up during 2022 or 2023 (8 buildings representing approximately 935,000 of rentable square feet) or under contract for sale. For 2023, the Same Store Portfolio consists of 137 properties aggregating 30.8 million rentable square feet. Properties that are being repositioned generally are defined as those properties where a significant amount of space is held vacant in order to implement capital improvements that enhance the functionality, rental cash flows, and value of that property. We define a significant amount of space at a property using both the size of the space and its proportion to the properties total square footage as a determinate. Our computation of same store NOI may not be comparable to other REITs. | |||||||||||||
| Weighted Average Lease Term Remaining: The average contractual lease term remaining as of the close of the reporting period (in years) weighted by square footage. | |||||||||||||
Page 18