Exhibit 99.2
![]()
Fourth Quarter 2022
Supplemental
| Plymouth Industrial REIT, Inc. |
| Table of Contents |
| Introduction | ||
| Executive Summary | 2 | |
| Management, Board of Directors, Investor Relations, and Equity Coverage | 2 | |
| Portfolio Statistics | 3 | |
| Acquisition Activity | 3 | |
| Select Recent Acquisitions | 4 | |
| Value Creation | 5 | |
| Development Projects | 5 | |
| Guidance | 6 | |
| Financial Information | ||
| Same Store Net Operating Income (NOI) | 7 | |
| Consolidated Statements of Operations | 8 | |
| Consolidated NOI | 9 | |
| Earnings Before Interest, Taxes, Depreciation and Amortization for Real Estate (EBITDAre) | 9 | |
| Funds from Operations (FFO), Core FFO & Adjusted Funds from Operations (AFFO) | 9 | |
| Consolidated Balance Sheets | 10 | |
| Capital Structure and Debt Summary | 11 | |
| Capital Markets Activity | 11 | |
| Net Asset Value Components | 12 | |
| Operational & Portfolio Information | ||
| Leasing Activity | 13 | |
| Lease Expiration Schedule | 13 | |
| Leased Square Feet and Annualized Base Rent by Tenant Industry | 14 | |
| Leased Square Feet and Annualized Base Rent by Type | 15 | |
| Top 10 Tenants by Annualized Base Rent | 16 | |
| Lease Segmentation by Size | 16 | |
| Rentable Square Feet and Annualized Base Rent by Market | 17 | |
| Total Acquisition and Replacement Cost by Market | 17 | |
| Appendix | ||
| Glossary | 18 | |
Forward-Looking Statements: This Supplemental Information contains forward-looking statements that are made pursuant to the safe harbor provisions of Section 27A of the Securities Act of 1933 and of Section 21E of the Securities Exchange Act of 1934. The forward-looking statements in this Supplemental Information do not constitute guarantees of future performance. Investors are cautioned that statements in this Supplemental Information, which are not strictly historical statements, including, without limitation, statements regarding management's plans, objectives and strategies, constitute forward-looking statements. Such forward-looking statements are subject to a number of known and unknown risks and uncertainties that could cause actual results to differ materially from those anticipated by the forward-looking statement, many of which may be beyond our control, including, without limitation, those factors described under the captions “Cautionary Note Regarding Forward-Looking Statements” and “Risk Factors” in the Company’s Annual Report on Form 10-K and Quarterly Reports on Form 10-Q filed with the Securities and Exchange Commission. Forward-looking statements generally can be identified by the use of forward-looking terminology such as “may,” “plan,” “seek,” “will,” “expect,” “intend,” “estimate,” “anticipate,” “believe” or “continue” or the negative thereof or variations thereon or similar terminology. Any forward-looking information presented herein is made only as of the date of this Supplemental Information, and we do not undertake any obligation to update or revise any forward-looking information to reflect changes in assumptions, the occurrence of unanticipated events, or otherwise.
Definitions and Reconciliations: For definitions of certain terms used throughout this Supplemental Information, including certain non-GAAP financial measures, refer to the Glossary on pages 18-19. For reconciliations of the non-GAAP financial measures to the most directly comparable U.S. GAAP measures, refer to page 9.
| Plymouth Industrial REIT, Inc. |
| Executive Summary |
| Company overview: Plymouth Industrial REIT, Inc. (NYSE: PLYM) is a full service, vertically integrated real estate investment trust company focused on the acquisition, ownership, and management of single and multi-tenant industrial properties. Our mission is to provide tenants with cost effective space that is functional, flexible and safe. | ||||||||
| Management, Board of Directors, Investor Relations, and Equity Coverage | ||||||||
| Corporate | Investor Relations | Transfer Agent | ||||||
| 20 Custom House Street, 11th Floor | Tripp Sullivan | Continental Stock Transfer & Trust Company | ||||||
| Boston, Massachusetts 02110 | SCR Partners | 1 State Street, 30th Floor | ||||||
| 617.340.3814 | 615.942.7077 | New York, NY 10004 | ||||||
| www.plymouthreit.com | tsullivan@scr-ir.com | 212.509.4000 | ||||||
| Executive Management | ||||||||
| Jeffrey E. Witherell | Pendleton P. White, Jr. | Anthony J. Saladino | James M. Connolly | |||||
| Chief Executive Officer | President and Chief Investment | Executive Vice President | Executive Vice President | |||||
| and Chairman | Officer | and Chief Financial Officer | Asset Management | |||||
| Lyndon J. Blakesley | Anne A. Hayward | |||||||
| Senior Vice President | Senior Vice President | |||||||
| and Chief Accounting Officer | and General Counsel | |||||||
| Board of Directors | ||||||||
| Martin Barber | Philip S. Cottone | Richard J. DeAgazio | David G. Gaw | |||||
| Independent Director | Independent Director | Independent Director | Lead Independent Director | |||||
| John W. Guinee | Caitlin Murphy | Pendleton P. White, Jr. | Jeffrey E. Witherell | |||||
| Independent Director | Independent Director | President and Chief Investment | Chief Executive Officer | |||||
| Officer | and Chairman | |||||||
| Equity Research Coverage1 | ||||||||
| Baird | BNP Paribas Exane | Colliers Securities | KeyBanc Capital Markets | |||||
| Dave Rodgers | Nate Crossett | Barry Oxford | Todd Thomas | |||||
| 216.737.7341 | 646.725.3716 | 203.961.6573 | 917.368.2375 | |||||
| BMO Capital Markets | B Riley Securities | JMP Securities | Truist Securities | |||||
| John Kim | Bryan Maher | Mitch Germain | Anthony Hau | |||||
| 212.885.4115 | 646.885.5423 | 212.906.3537 | 212.303.4176 | |||||
| Investor Conference Call and Webcast: The Company will host a conference call and live audio webcast, both open for the general public to hear, on February 23, 2023 at 9:00 a.m. Eastern Time. The number to call for this interactive teleconference is (844) 784-1727 (international callers: (412) 717-9587). A replay of the call will be available through March 2, 2023 by dialing (877) 344-7529 and entering the replay access code, 1228355. |
|||||||||
1) The analysts listed provide research coverage on the Company. Any opinions, estimates or forecasts regarding the Company's performance made by these analysts are theirs alone and do not represent opinions, estimates or forecasts by the Company or its management. The Company does not by reference above imply its endorsement of or concurrence with such information, conclusions or recommendations.
Page 2
| Plymouth Industrial REIT, Inc. |
| Portfolio Statistics |
| Unaudited ($ in thousands, except Cost/SF) as of 12/31/2022 |
| Portfolio Snapshot | Portfolio Growth ($ in millions) | |||||||||
| Number of Properties | 157 | 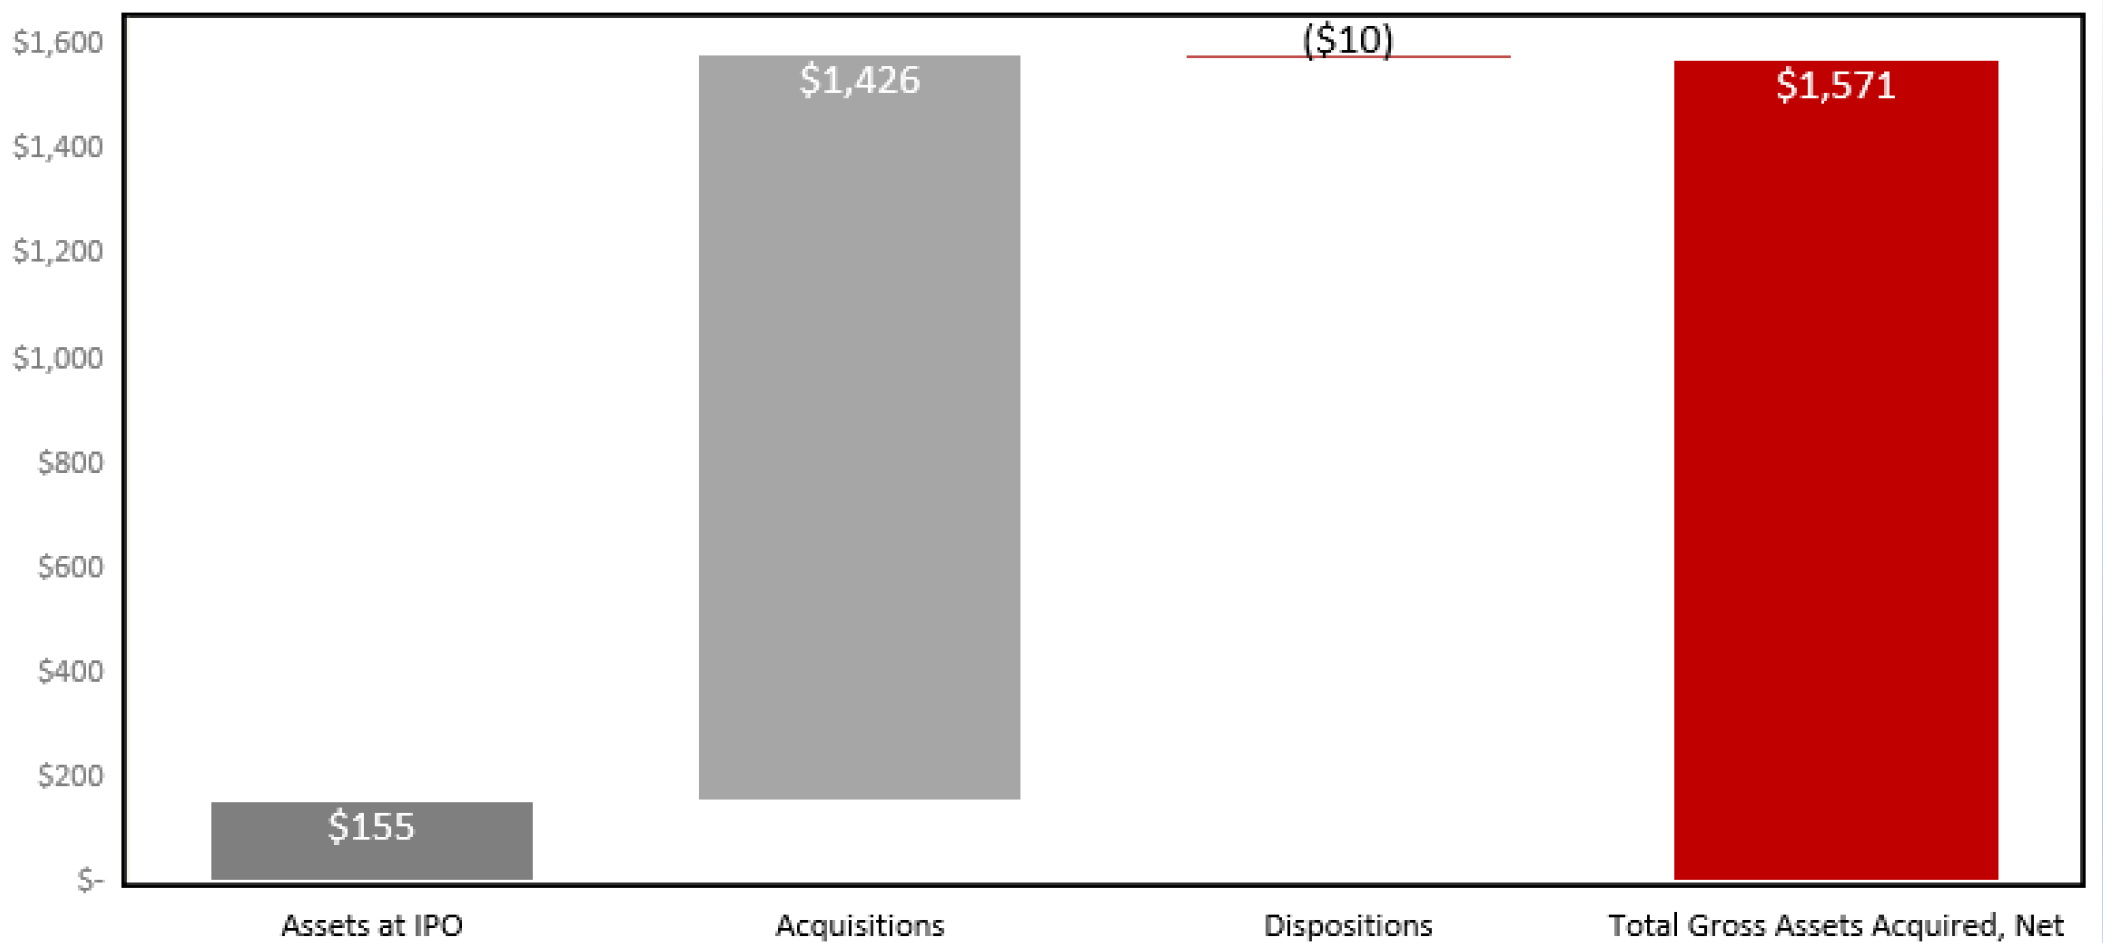 | ||||||||
| Number of Buildings | 208 | |||||||||
| Square Footage | 33,837 | |||||||||
| Occupancy | 99.0% | |||||||||
| WA Lease Term Remaining (yrs.)1 | 3.5 | |||||||||
| Total Annualized Base Rent (ABR)2 | $144,987 | |||||||||
| Rental Rate Increase - Cash basis3 | 18.1% | |||||||||
| Q4 Rent Collections | 98.7% | |||||||||
| Acquisition Activity | |||||||||||||
| 2022 Transaction Summary | Investment Highlights | ||||||||||||
| Purchase Price5 | $253,655 | ● | Since the Company's IPO in June 2017, the Company has acquired approximately $1.43 billion of wholly owned warehouse, distribution, light manufacturing, and small bay industrial properties totaling 29.9 million square feet. | ||||||||||
| Cost Per Square Foot | $71.54 | ||||||||||||
| Replacement Cost/SF4 | $98.64 | ||||||||||||
| Square Footage Acquired | 4,165 | ● | The Company has 643,000 SF of industrial projects set for delivery in phase 1 of the development plan. The development pipeline totals over 1.7 million square feet of gross leasable area. | ||||||||||
| WA Occupancy at Acquisition | 93.0% | ||||||||||||
| WA Lease Term Remaining (yrs.)1 | 3.1 | ||||||||||||
| Acquisitions | ||||||||||||
| Location | Acquisition
Date |
# of Buildings | Purchase
Price5 |
Square
Footage |
Projected
Initial Yield6 |
Cost
per Square Foot7 | ||||||
| Multiple | Full Year 2022 | 44 | $ 253,655 | 4,164,864 | 6.1% | $ 71.54 | ||||||
| Multiple | Full Year 2021 | 24 | $ 370,977 | 6,380,302 | 6.7% | $ 63.15 | ||||||
| Multiple | Full Year 2020 | 27 | $ 243,568 | 5,473,596 | 7.8% | $ 46.99 | ||||||
| Multiple | Full Year 2019 | 32 | $ 220,115 | 5,776,928 | 8.4% | $ 42.21 | ||||||
| Multiple | Full Year 2018 | 24 | $ 164,575 | 2,903,699 | 8.2% | $ 70.54 | ||||||
| Multiple | 2017 (since IPO) | 36 | $ 173,325 | 5,195,563 | 8.4% | $ 33.81 | ||||||
| Total Acquisitions Post-IPO | 187 | $ 1,426,215 | 29,894,952 | 7.4% | $ 55.94 | |||||||
| Portfolio statistics and acquisitions include wholly owned industrial properties only; excludes our property management office located in Columbus, Ohio. |
| 1) | The average contractual lease term remaining as of the close of the reporting period (in years) weighted by square footage. |
| 2) | Annualized base rent is calculated as monthly contracted base rent as of December 31, 2022, multiplied by 12. Excludes rent abatements. |
| 3) | Based on approximately 2.3 million square feet of new and renewal leases greater than six months in term. Refer to Leasing Activity in this Supplemental Information for additional details. |
| 4) | Replacement cost is based on the Marshall & Swift valuation methodology for the determination of building costs. Replacement cost includes land reflected at the allocated cost in accordance with GAAP. |
| 5) | Represents total direct consideration paid rather than GAAP cost basis. |
| 6) | Weighted based on Purchase Price. |
| 7) | Calculated as Purchase Price divided by square footage. |
Page 3
| Plymouth Industrial REIT, Inc. | |
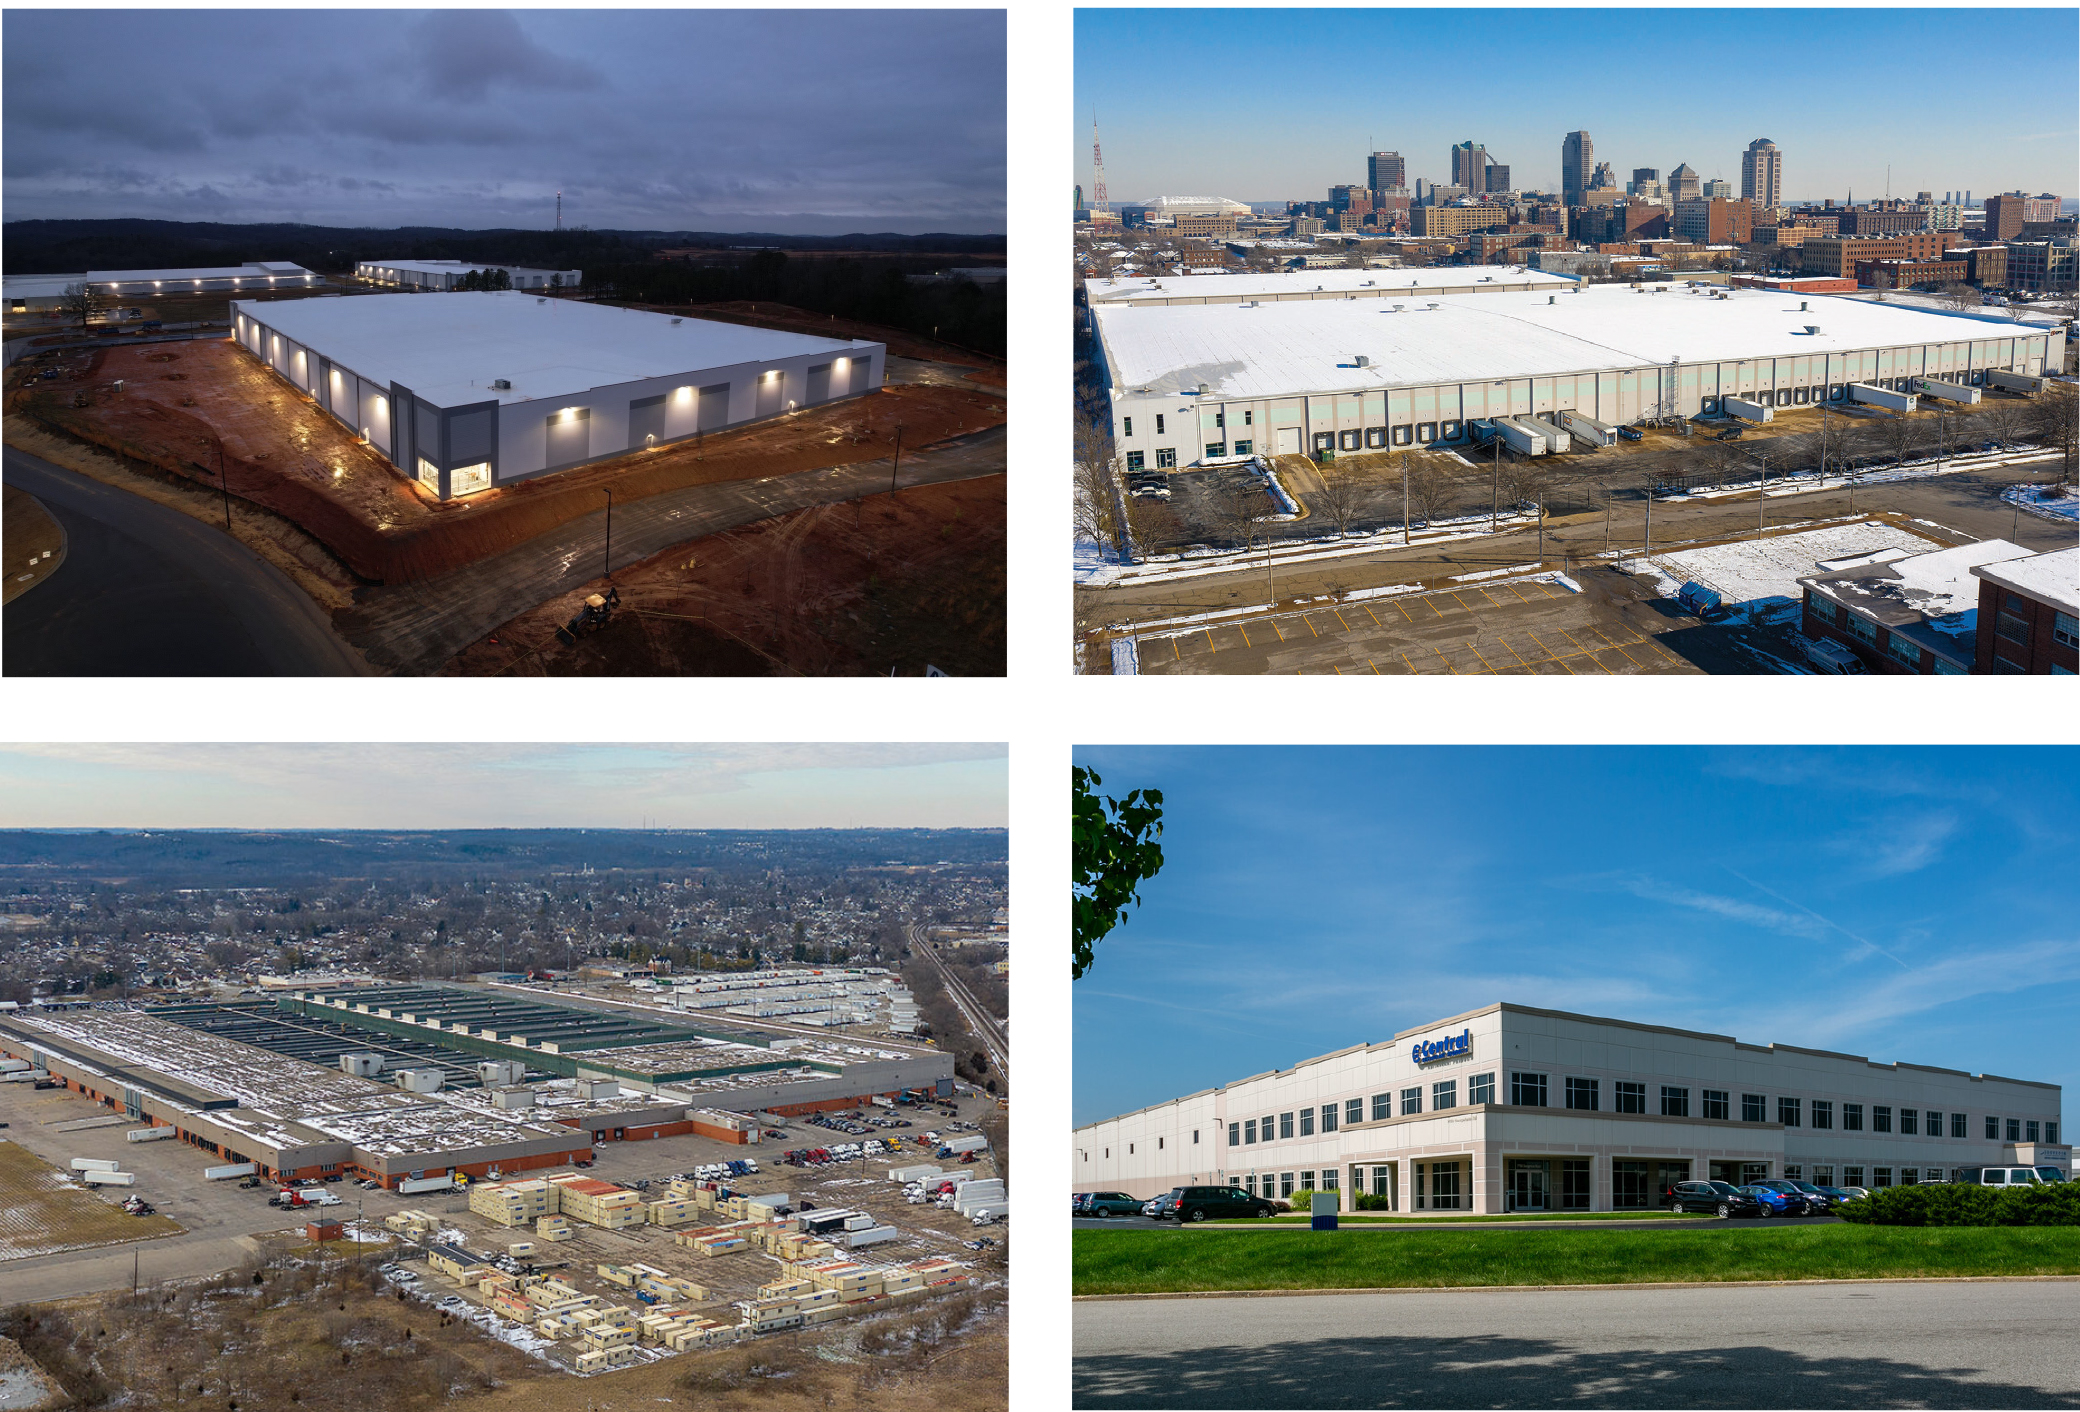
| Select Recent Acquisitions | |
| During the year ended December 31, 2022, the Company acquired forty-four (44) wholly-owned industrial buildings totaling 4.2 million square feet for a total consideration of $253.7 million in its key markets at a weighted average projected initial yield of 6.1% and a weighted average price of approximately $72 per square foot | |
| Unaudited ($ in thousands, except Cost/SF) | |
| Rockside Logistics Center | ||||
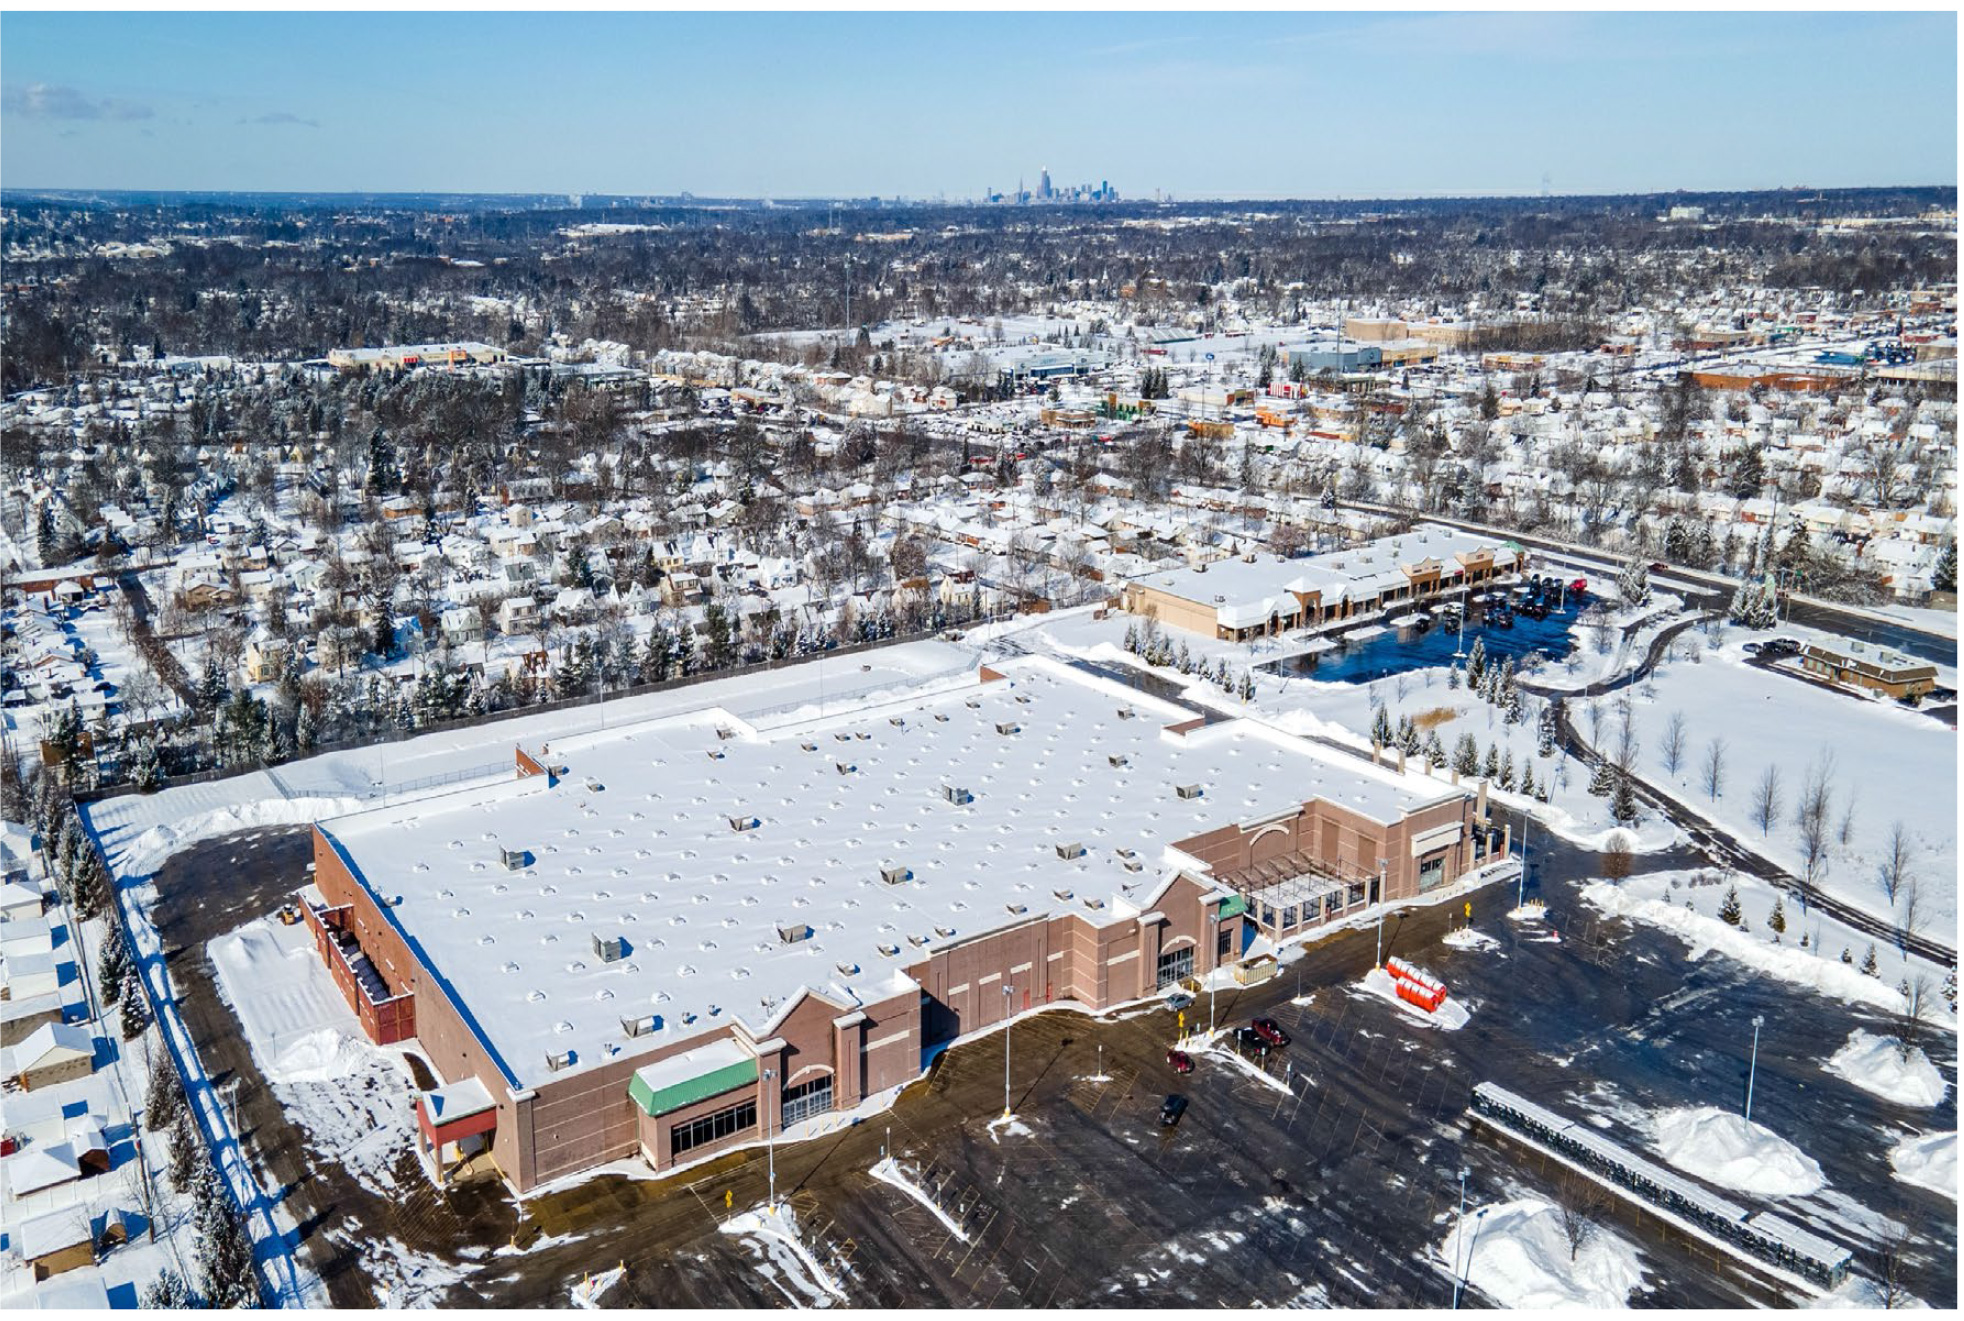 |
Location | Cleveland | ||
| Acquisition Date | July-22 | |||
| # of Buildings | 1 | |||
| Purchase Price1 | $16,500 | |||
| Square Footage | 197,518 | |||
| Occupancy at Acquisition | 100.0% | |||
| WA Lease Term Remaining | 4.6 years | |||
| Projected Initial Yield | 6.3% | |||
| Purchase Price/SF2 | $83.54 | |||
| Replacement Cost/SF2 | $147.85 | |||
| Multi-Tenant % | 0% | |||
| Single-Tenant % | 100% | |||
| Location Characteristics: Cleveland, a pivotal industrial market along the industrial beltway which spans from Philadelphia to Chicago, has seen record absorption and demand numbers for all industrial product. The market is home to 9 Fortune 1000 companies and a highly skilled workforce, making it a perfect place for industrial growth and occupancy | ||||
| Market Insight: 7 of the last 8 quarters have experienced significant positive absorption, which has kept vacancy rates under 2% since 2020. The market's modest development pipeline will have trouble keeping up with demand, allowing room for growth in lease rates and keeping vacancies low (source: CBRE) | ||||
| Portfolio Fit: Brings Company's scale in the Cleveland market to approximately 4.0 million square feet | ||||
| Memphis Industrial Portfolio | ||||
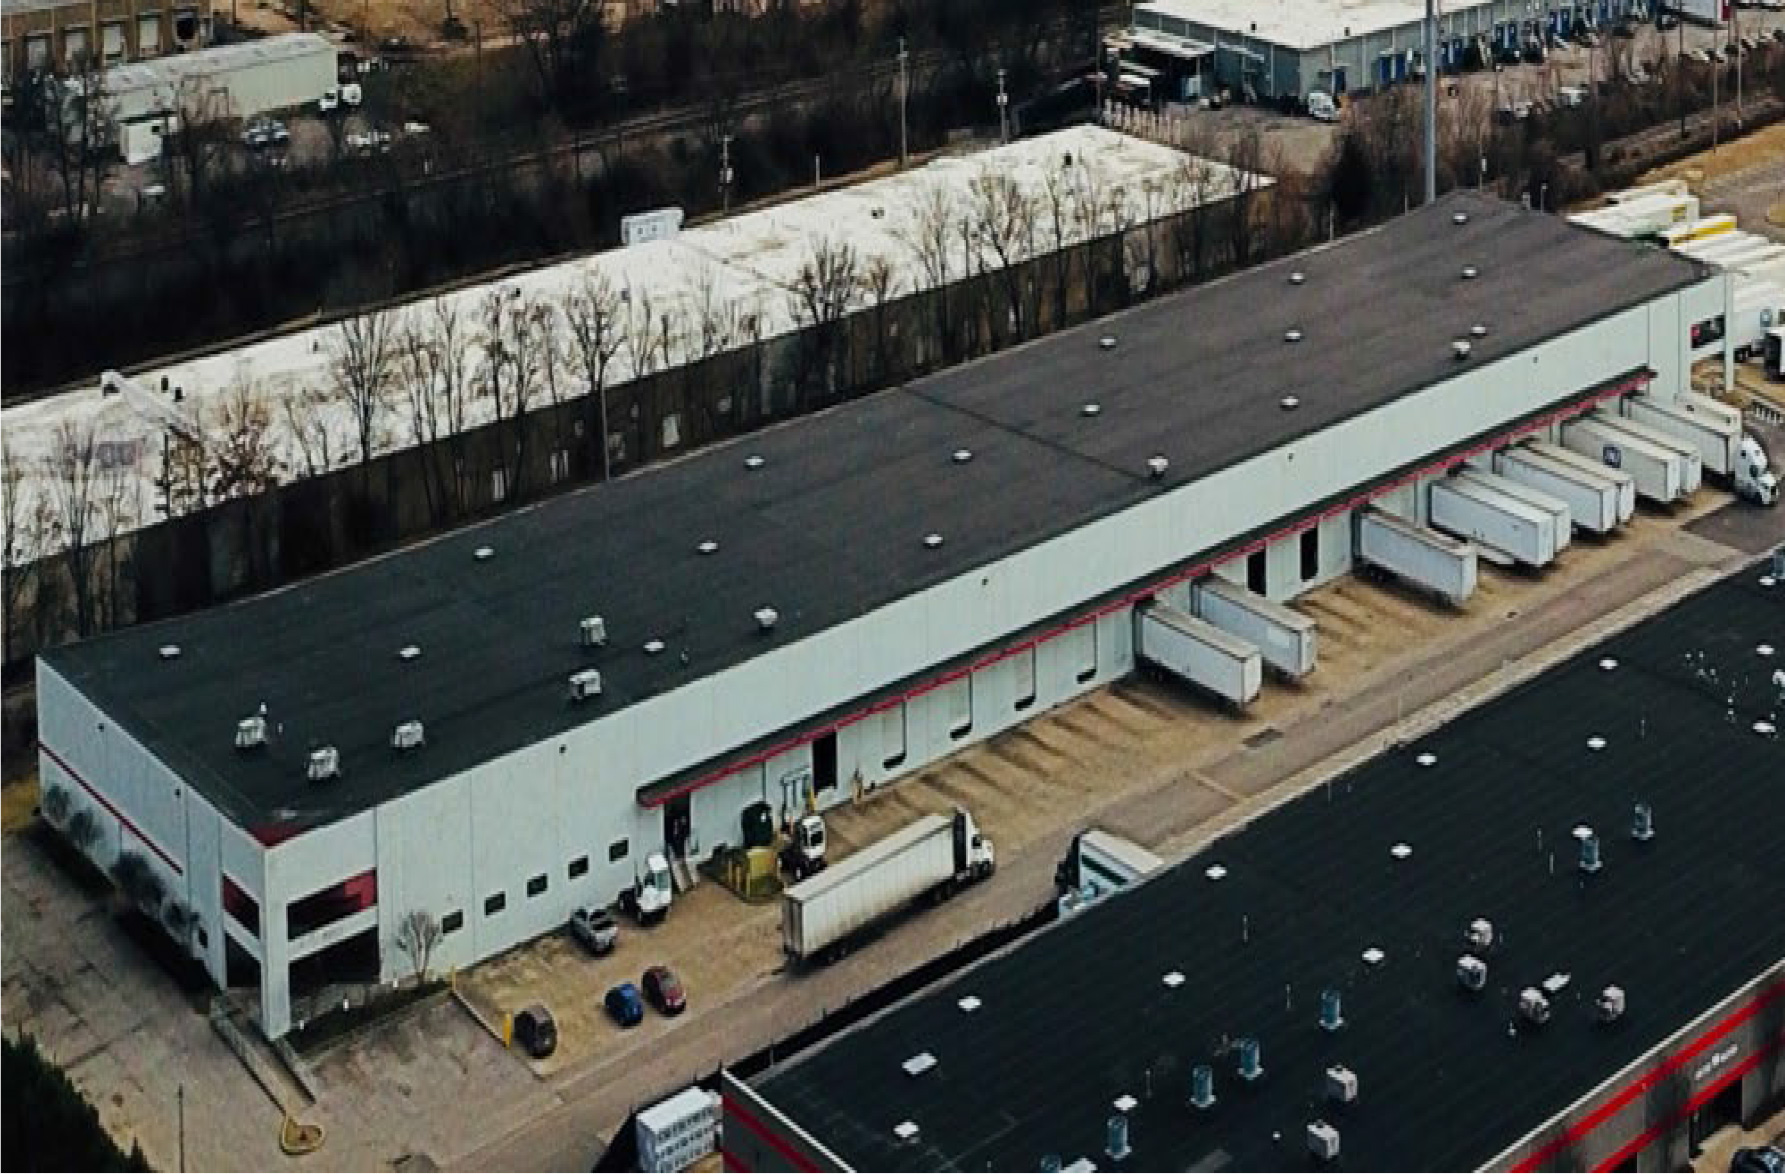 |
Location | Memphis | ||
| Acquisition Date | March-22 | |||
| # of Buildings | 28 | |||
| Purchase Price1 | $102,355 | |||
| Square Footage | 2,320,773 | |||
| Occupancy at Acquisition | 93.0% | |||
| WA Lease Term Remaining | 3.0 years | |||
| Projected Initial Yield | 6.6% | |||
| Purchase Price/SF2 | $44.10 | |||
| Replacement Cost/SF2 | $78.02 | |||
| Multi-Tenant % | 36% | |||
| Single-Tenant % | 64% | |||
| Location Characteristics: Memphis experienced 11.9 million SF of positive absorption in 2021 and an influx of Fortune 500 Co's in recent years. Ford is building an electric vehicle manufacturing facility that will provide 6,000 new jobs by 2025, and FedEx's global headquarters is based here, making the international airport one of the busiest cargo airports in the country | ||||
| Market Insight: Employment has increased 12% since 2011 and there has been an uptick in spec development in recent years, showing signs of economic growth in the area, however, availability rate and vacancy rate are at all-time lows, allowing for projected rent growth to be at 5% per year over the next 5 years (source: CBRE) | ||||
| Portfolio Fit: Brings Company's scale in the Memphis market to greater than 4.7 million square feet | ||||
| 1) | Represents total direct consideration paid rather than GAAP cost basis. |
| 2) | Replacement cost is based on the Marshall & Swift valuation methodology for the determination of building costs. Replacement cost includes land reflected at the allocated cost in accordance with GAAP. |
Page 4
| Plymouth Industrial REIT, Inc. |
| Value Creation |
| Unaudited ($ in thousands, except RSF) |
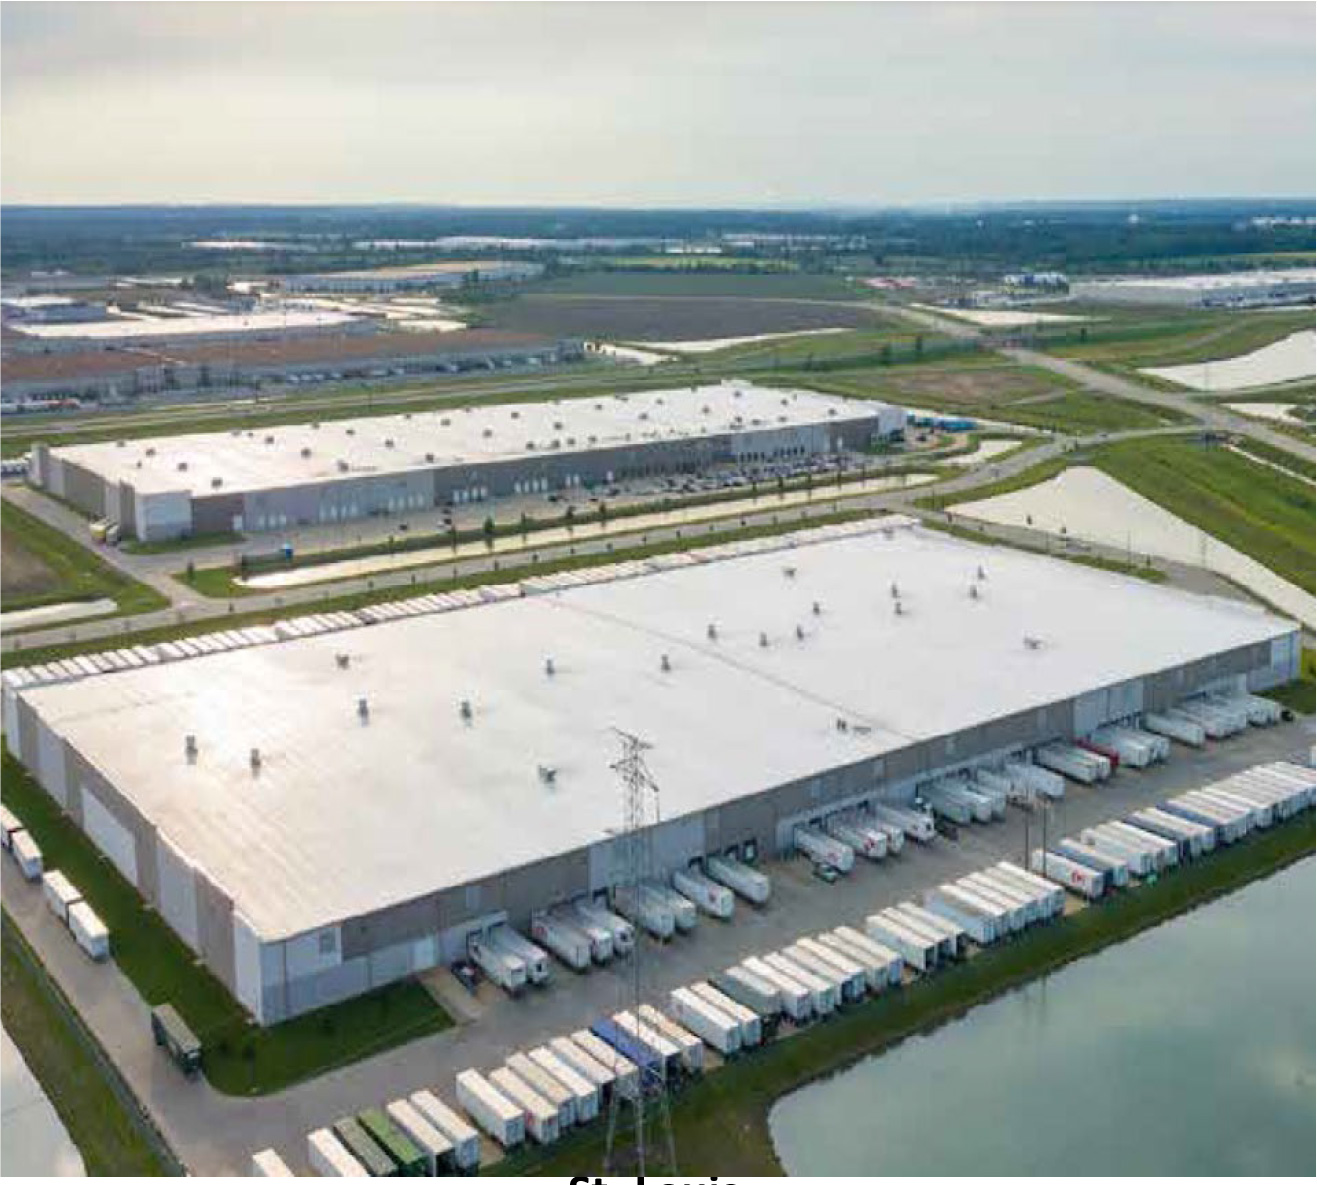
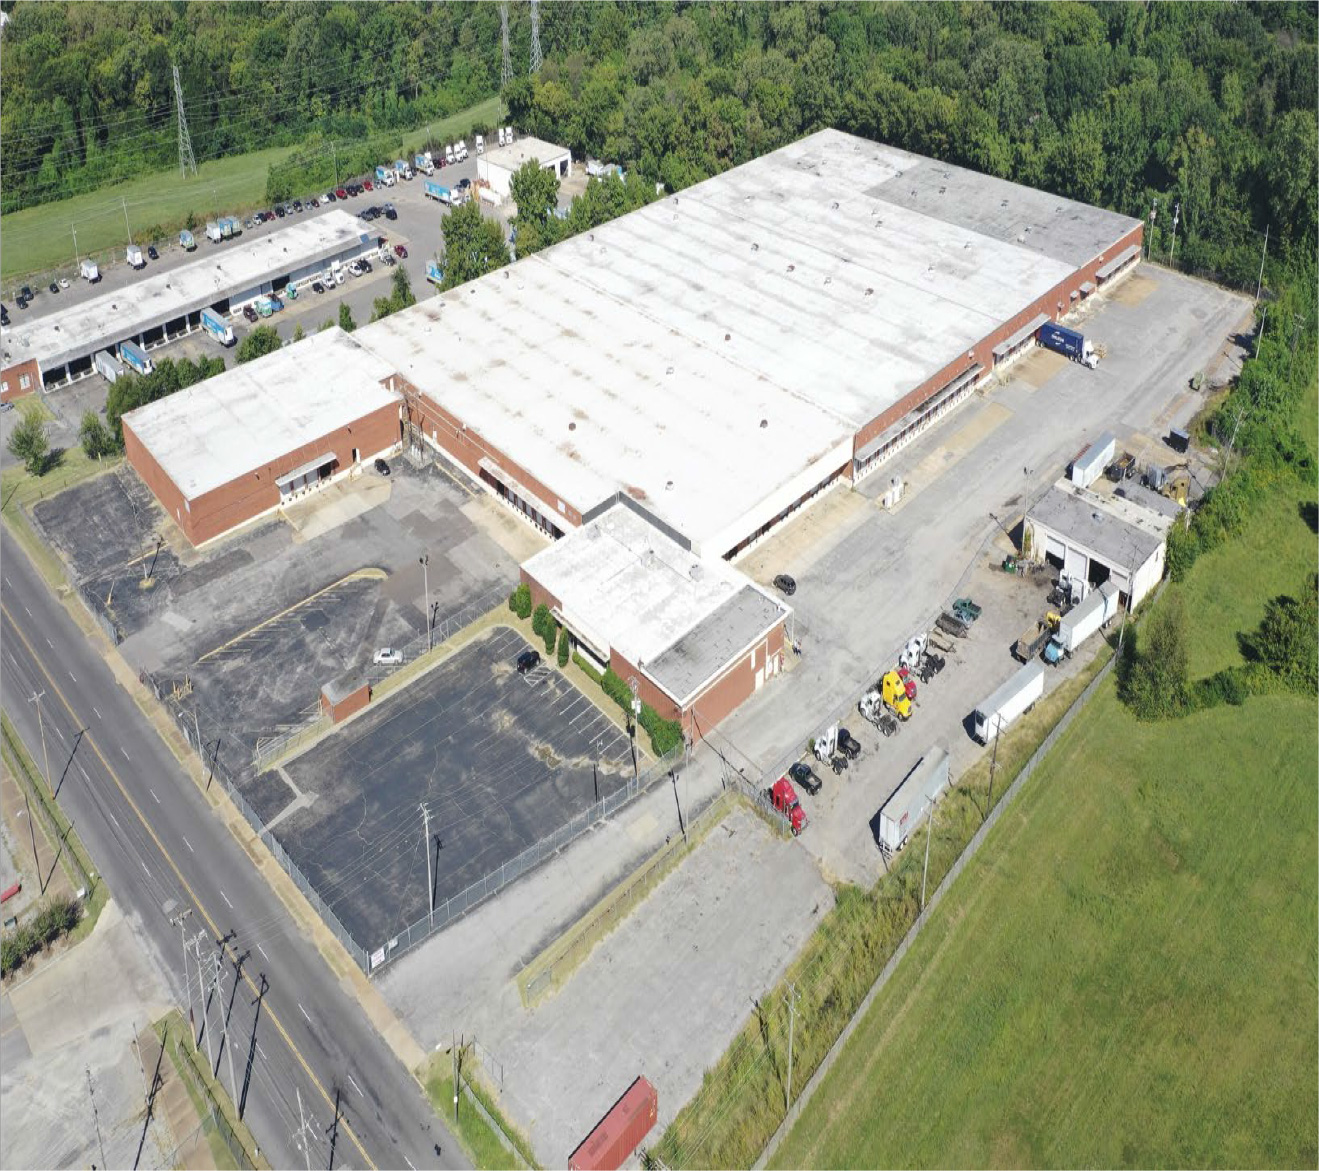
| Examples of Value Creation |
| Re-leasing / No downtime | Lease-up / Building Refurbishment | New Industrial Development | ||
 |
 |
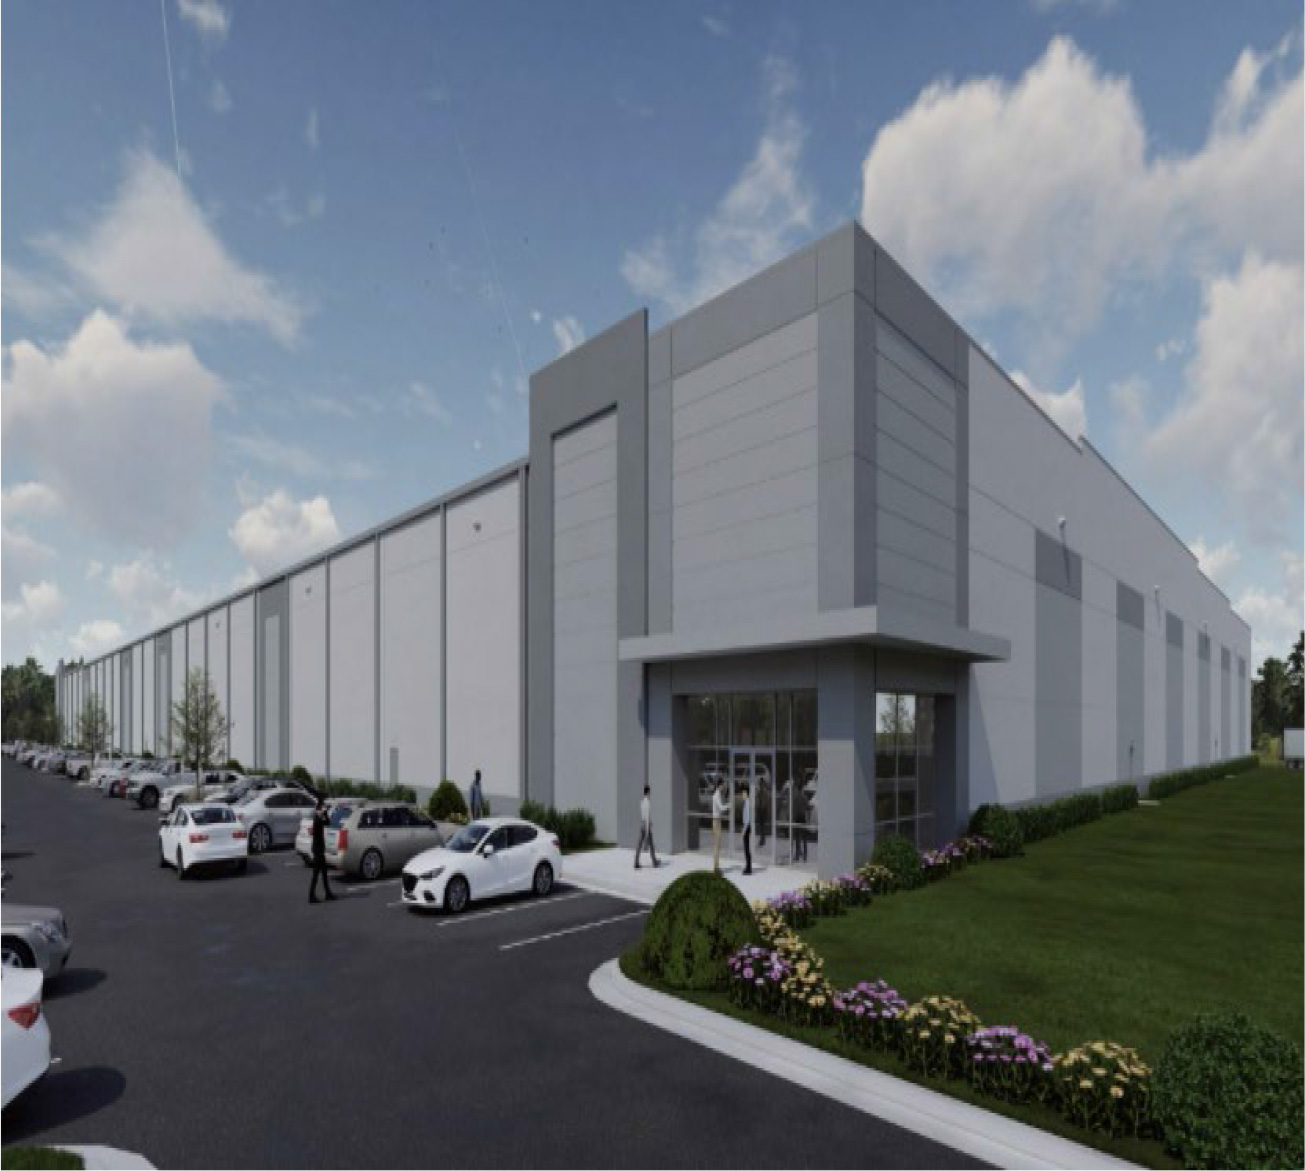 | ||
| St. Louis | Memphis | Atlanta | ||
| Executed two 3-year lease renewals with two Top-10 tenants by ABR encompassing approximately 1.2 million square feet across neighboring buildings | Executed a 312,000 SF 5-year lease with annual escalators of 3.0% at a rental rate increase of 56% over prior rents | Acquired single-tenant industrial building in January 2020 with ~ 65 acres of developable land | ||
| The starting rental rates for the renewal leases average a 20% increase over the expiring rents with a 2.75% annual escalators | Tenant move-out was addressed expeditiously. The building will undergo roof and fire suppression upgrades as a part of the new lease transaction | Broke ground on new 237,000 SF building during Q2 2021 with an estimated turnkey in Q1 2023 at a cost of ~$13.6M, an add'l 180,000 SF building is projected for Q2 2023 at a cost of ~$12.2M | ||
| The properties were acquired at a going-in yield of 5.75%, which now has improved by approximately 125 bps upon stabilization | The property was acquired at a going-in yield of 8.0%, which now has increased to a stabilized yield of over 11.0% | Flexible design planned for both buildings to allow for demising. The 237,000 SF building is 100% leased |
| Plymouth is partnering with the Green Building Initiative to align our environmental objectives with the execution of all new development and portfolio enhancement activities1 |
| Development Projects (as of 12/31/2022) | ||
| The Company has identified over 2.3 million SF of developable GLA and currently has 643,000 SF under construction. The total investment in development under construction is approximately $43.0 million as of 12/31/2022 against a budget of approximately $49.0 million. The proforma stabilized cash NOI yields on development projects under construction range between 7.0% - 9.0% | ||
| Total Rentable | Estimated | ||||||||||
| Under Construction2 | # of Buildings | Square Feet (RSF) | % Leased | % Funded | Completion | ||||||
| Boston - Milliken Road | 1 | 70,000 | 50% | 97% | Q4 2022 | ||||||
| Atlanta - New Calhoun I | 1 | 237,000 | 100% | 90% | Q1 2023 | ||||||
| Atlanta - New Calhoun II | 1 | 180,000 | 0% | 88% | Q2 2023 | ||||||
| Cincinnati - Fisher Park I | 1 | 156,000 | Multiple prospects | 80% | Q2 2023 | ||||||
| 4 | 643,000 |
| 1) | The Company is a member organization of the Green Building Initiative (GBI), a nonprofit organization and American National Standards Institute (ANSI) Accredited Standards Developer dedicated to reducing climate impacts by improving the built environment. Founded in 2004, the organization is the global provider of the Green Globes and federal Guiding Principles Compliance certification and assessment programs. | ||||||||||||
| 2) | Under construction represents projects for which vertical construction has commenced. Refer to the Developable Land section of the Net Asset Components on page 12 of this Supplemental Information for additional details on the Company's development activities. | ||||||||||||
Page 5
| Plymouth Industrial REIT, Inc. |
| Guidance |
| Unaudited (in thousands, except per-share amounts) |
| Full Year 2023 Range1 | ||||||||
| Low | High | |||||||
| Core FFO attributable to common stockholders and unit holders per share | $ | 1.84 | $ | 1.86 | ||||
| Same Store Portfolio NOI growth - cash basis2 | 7.25% | 7.75% | ||||||
| Average Same Store Portfolio occupancy - full year | 98.4% | 98.8% | ||||||
| General and administrative expenses3 | $ | 15,900 | $ | 15,500 | ||||
| Interest expense, net | $ | 39,300 | $ | 38,500 | ||||
| Weighted average common shares and units outstanding4 | 43,537 | 43,537 | ||||||
Reconciliation of net loss attributable to common stockholders and unit holders per share to Core FFO guidance:
| Full Year 2023 Range1 | ||||||||
| Low | High | |||||||
| Net loss | $ | (0.13 | ) | $ | (0.11 | ) | ||
| Depreciation and amortization | 2.05 | 2.05 | ||||||
| Preferred stock dividends | (0.08 | ) | (0.08 | ) | ||||
| $ | 1.84 | $ | 1.86 | |||||
| 1) | Our 2023 guidance refers to the Company's in-place portfolio as of February 20, 2023. Our 2023 guidance does not include prospective acquisitions beyond February 20, 2023, dispositions, or capitalization activities that have not closed. |
| 2) | The Same Store Portfolio consists of 183 buildings aggregating 30,989,249 rentable square feet, representing approximately 92% of total in-place portfolio square footage. The Same Store projected performance reflects an annual NOI on a cash basis, excluding termination income. |
| 3) | Includes non-cash stock compensation of $3.1 million for 2023. |
| 4) | As of February 20, 2023, the Company has 43,521,163 common shares and units outstanding. |
Page 6
| Plymouth Industrial REIT, Inc. |
| Same Store Net Operating Income (NOI) |
| Unaudited ($ and SF in thousands) |
| Same Store Portfolio Statistics |
| Square footage | 21,962 | Includes: wholly owned properties as of December 31, 2020; determined and set once per year for the following twelve months (refer to Glossary for Same Store definition) | ||
| Number of properties | 99 | |||
| Number of buildings | 121 | |||
| Percentage of total portfolio square footage | 64.9% | Excludes: wholly owned properties classified as repositioning or lease-up during 2021 or 2022 (10 properties representing approximately 1,266,000 of rentable square feet) | ||
| Occupancy at period end | 99.2% | |||
| Same Store NOI - GAAP Basis |
| Three Months Ended December 31, | ||||||||||||||||
| 2022 | 2021 | $ Change | % Change | |||||||||||||
| Rental revenue | $ | 31,386 | $ | 31,158 | $ | 228 | 0.7% | |||||||||
| Property expenses | 10,129 | 10,903 | (774 | ) | -7.1% | |||||||||||
| Same Store NOI - GAAP Basis | $ | 21,257 | $ | 20,255 | $ | 1,002 | 4.9% | |||||||||
| Same Store NOI excluding early termination income - GAAP Basis | $ | 21,191 | $ | 19,900 | $ | 1,291 | 6.5% | |||||||||
| Year Ended December 31, | ||||||||||||||||
| 2022 | 2021 | $ Change | % Change | |||||||||||||
| Rental revenue | $ | 125,436 | $ | 120,825 | $ | 4,611 | 3.8% | |||||||||
| Property expenses | 40,645 | 40,747 | (102 | ) | -0.3% | |||||||||||
| Same Store NOI - GAAP Basis | $ | 84,791 | $ | 80,078 | $ | 4,713 | 5.9% | |||||||||
| Same Store NOI excluding early termination income - GAAP Basis | $ | 84,642 | $ | 78,800 | $ | 5,842 | 7.4% | |||||||||
| Same Store NOI - Cash Basis |
| Three Months Ended December 31, | ||||||||||||||||
| 2022 | 2021 | $ Change | % Change | |||||||||||||
| Rental revenue | $ | 30,886 | $ | 29,949 | $ | 937 | 3.1% | |||||||||
| Property expenses | 10,129 | 10,903 | (774 | ) | -7.1% | |||||||||||
| Same Store NOI - Cash Basis | $ | 20,757 | $ | 19,046 | $ | 1,711 | 9.0% | |||||||||
| Same Store NOI excluding early termination income - Cash Basis | $ | 20,691 | $ | 18,691 | $ | 2,000 | 10.7% | |||||||||
| Year Ended December 31, | ||||||||||||||||
| 2022 | 2021 | $ Change | % Change | |||||||||||||
| Rental revenue | $ | 122,437 | $ | 115,806 | $ | 6,631 | 5.7% | |||||||||
| Property expenses | 40,645 | 40,747 | (102 | ) | -0.3% | |||||||||||
| Same Store NOI - Cash Basis | $ | 81,792 | $ | 75,059 | $ | 6,733 | 9.0% | |||||||||
| Same Store NOI excluding early termination income - Cash Basis | $ | 81,643 | $ | 73,781 | $ | 7,862 | 10.7% | |||||||||
Page 7
| Plymouth Industrial REIT, Inc. |
| Consolidated Statements of Operations |
| Unaudited ($ in thousands, except per-share amounts) |
| For the Three Months Ended December 31, | For the Year Ended December 31, | |||||||||||||||
| 2022 | 2021 | 2022 | 2021 | |||||||||||||
| Revenues: | ||||||||||||||||
| Rental revenue | $ | 36,576 | $ | 30,476 | $ | 141,085 | $ | 108,110 | ||||||||
| Tenant recoveries | 10,746 | 9,326 | 42,357 | 32,160 | ||||||||||||
| Management fee revenue and other income1 | 4 | 83 | 94 | 348 | ||||||||||||
| Total revenues | $ | 47,326 | $ | 39,885 | $ | 183,536 | $ | 140,618 | ||||||||
| Operating expenses: | ||||||||||||||||
| Property | 14,232 | 13,238 | 56,601 | 47,636 | ||||||||||||
| Depreciation and amortization | 23,553 | 19,658 | 95,312 | 70,642 | ||||||||||||
| General and administrative | 4,163 | 3,338 | 15,939 | 12,920 | ||||||||||||
| Total operating expenses | $ | 41,948 | $ | 36,234 | $ | 167,852 | $ | 131,198 | ||||||||
| Other income (expense): | ||||||||||||||||
| Interest expense | (8,914 | ) | (5,479 | ) | (32,217 | ) | (19,968 | ) | ||||||||
| Earnings (loss) in investment of unconsolidated joint venture2 | — | (175 | ) | (147 | ) | (850 | ) | |||||||||
| Loss on extinguishment of debt | — | (523 | ) | (2,176 | ) | (523 | ) | |||||||||
| Gain on sale of real estate3 | — | 1,185 | — | 1,775 | ||||||||||||
| (Appreciation) depreciation of warrants4 | — | (3,312 | ) | 1,760 | (5,121 | ) | ||||||||||
| Total other income (expense) | $ | (8,914 | ) | $ | (8,304 | ) | $ | (32,780 | ) | $ | (24,687 | ) | ||||
| Net loss | $ | (3,536 | ) | $ | (4,653 | ) | $ | (17,096 | ) | $ | (15,267 | ) | ||||
| Less: Net loss attributable to non-controlling interest | (40 | ) | (66 | ) | (210 | ) | (259 | ) | ||||||||
| Net loss attributable to Plymouth Industrial REIT, Inc. | $ | (3,496 | ) | $ | (4,587 | ) | $ | (16,886 | ) | $ | (15,008 | ) | ||||
| Less: Preferred stock dividends | 917 | 1,652 | 4,866 | 6,608 | ||||||||||||
| Less: Series B preferred stock accretion to redemption value | — | 1,807 | 4,621 | 7,228 | ||||||||||||
| Less: Loss on extinguishment of Series A Preferred Stock | 19 | — | 99 | — | ||||||||||||
| Less: Amount allocated to participating securities | 62 | 48 | 256 | 201 | ||||||||||||
| Net loss attributable to common stockholders | $ | (4,494 | ) | $ | (8,094 | ) | $ | (26,728 | ) | $ | (29,045 | ) | ||||
| Net loss basic and diluted per share attributable to common stockholders | $ | (0.11 | ) | $ | (0.23 | ) | $ | (0.67 | ) | $ | (0.94 | ) | ||||
| Weighted-average common shares outstanding basic and diluted | 42,569 | 34,690 | 39,779 | 30,911 | ||||||||||||
| 1) | Represents management fee revenue earned from the unconsolidated joint venture and other miscellaneous income. |
| 2) | Represents our share of earnings (losses) related to our investment in an unconsolidated joint venture. The Company acquired the remaining 80% interest in our unconsolidated JV in March 2022. |
| 3) | For the year ended December 31, 2021, the Company sold two properties totaling 98,340 and 74,613 square feet respectively, recognizing a net gain of $1,775. No sales of real estate occurred during the year ended December 31, 2022. |
| 4) | Represents the change in the fair market value of our common stock warrants. On March 23, 2022, the common stock warrants were exercised in full and converted on a cashless basis, resulting in 139,940 shares of common stock. |
Page 8
| Plymouth Industrial REIT, Inc. |
| Non-GAAP Measurements |
| Unaudited ($ in thousands, except per-share amounts) |
| Consolidated NOI | |||||||||
| For the Three Months Ended December 31, |
For the Year Ended December 31, |
||||||||
| 2022 | 2021 | 2022 | 2021 | ||||||
| Net loss | $ (3,536) | $ (4,653) | $ (17,096) | $ (15,267) | |||||
| General and administrative | 4,163 | 3,338 | 15,939 | 12,920 | |||||
| Depreciation and amortization | 23,553 | 19,658 | 95,312 | 70,642 | |||||
| Interest expense | 8,914 | 5,479 | 32,217 | 19,968 | |||||
| (Earnings) loss in investment of unconsolidated joint venture1 | - | 175 | 147 | 850 | |||||
| Loss on extinguishment of debt | - | 523 | 2,176 | 523 | |||||
| Gain on sale of real estate | - | (1,185) | - | (1,775) | |||||
| Appreciation (depreciation) of warrants2 | - | 3,312 | (1,760) | 5,121 | |||||
| Management fee revenue and other Income3 | (4) | (83) | (94) | (348) | |||||
| Net Operating Income | $ 33,090 | $ 26,564 | $ 126,841 | $ 92,634 | |||||
| Earnings Before Interest, Taxes, Depreciation and Amortization for Real Estate (EBITDAre) | |||||||||
| Net loss | $ (3,536) | $ (4,653) | $ (17,096) | $ (15,267) | |||||
| Depreciation and amortization | 23,553 | 19,658 | 95,312 | 70,642 | |||||
| Interest expense | 8,914 | 5,479 | 32,217 | 19,968 | |||||
| Loss on extinguishment of debt | - | 523 | 2,176 | 523 | |||||
| Gain on sale of real estate | - | (1,185) | - | (1,775) | |||||
| Appreciation (depreciation) of warrants2 | - | 3,312 | (1,760) | 5,121 | |||||
| EBITDAre | $ 28,931 | $ 23,134 | $ 110,849 | $ 79,212 | |||||
| Stock compensation | 1,105 | 340 | 2,603 | 1,559 | |||||
| Acquisition expenses | - | - | 201 | - | |||||
| Pro forma effect of acquisitions/developments4 | 168 | 974 | 2,517 | 3,114 | |||||
| EBITDA adjustments attributable to unconsolidated joint venture5 | - | 456 | - | 1,909 | |||||
| Adjusted EBITDA | $ 30,204 | $ 24,904 | $ 116,170 | $ 85,794 | |||||
| Funds from Operations (FFO), Core FFO & Adjusted Funds from Operations (AFFO) | |||||||||
| Net loss | $ (3,536) | $ (4,653) | $ (17,096) | $ (15,267) | |||||
| Gain on sale of real estate | - | (1,185) | - | (1,775) | |||||
| Depreciation and amortization | 23,553 | 19,658 | 95,312 | 70,642 | |||||
| Depreciation and amortization from unconsolidated joint venture | - | 363 | 268 | 1,539 | |||||
| FFO | $ 20,017 | $ 14,183 | $ 78,484 | $ 55,139 | |||||
| Preferred stock dividends | (917) | (1,652) | (4,866) | (6,608) | |||||
| Acquisition expenses | - | - | 201 | - | |||||
| Appreciation (depreciation) of warrants2 | - | 3,312 | (1,760) | 5,121 | |||||
| Loss on extinguishment of debt | - | 523 | 2,176 | 523 | |||||
| Core FFO | $ 19,100 | $ 16,366 | $ 74,235 | $ 54,175 | |||||
| Amortization of debt related costs | 566 | 443 | 2,163 | 1,605 | |||||
| Non-cash interest expense | 666 | 222 | 2,248 | 191 | |||||
| Stock compensation | 1,105 | 340 | 2,603 | 1,559 | |||||
| Capitalized interest | (604) | - | (1,125) | - | |||||
| Straight line rent | (637) | (974) | (3,682) | (3,700) | |||||
| Above/below market lease rents | (519) | (507) | (3,151) | (2,096) | |||||
| Recurring capital expenditures6 | (1,353) | (2,040) | (6,793) | (8,767) | |||||
| AFFO | $ 18,324 | $ 13,850 | $ 66,498 | $ 42,967 | |||||
| Weighted-average common shares and units outstanding | 43,340 | 35,414 | 40,553 | 31,691 | |||||
| Core FFO attributable to common stockholders and unit holders per share | $ 0.44 | $ 0.46 | $ 1.83 | $ 1.71 | |||||
| AFFO attributable to common stockholders and unit holders per share | $ 0.42 | $ 0.39 | $ 1.64 | $ 1.36 | |||||
| 1) | Represents our share of (earnings) losses related to our investment in an unconsolidated joint venture. |
| 2) | Represents the change in the fair market value of our common stock warrants. On March 23, 2022, the common stock warrants were exercised in full and converted on a cashless basis, resulting in 139,940 shares of common stock. |
| 3) | Represents management fee revenue earned from the unconsolidated joint venture and other miscellaneous income. |
| 4) | Represents the estimated impact of wholly owned acquisitions and development properties as if they had been acquired or stabilized on the first day of each respective quarter in which the acquisitions occured or developments were placed in-service. We have made a number of assumptions in such estimates and there can be no assurance that we would have generated the projected levels of EBITDA had we owned the acquired properties and/or placed the development properties in-service as of the beginning of the respective periods. |
| 5) | Represents depreciation and amortization, and interest expense from the Company's unconsolidated joint venture. The Company acquired the remaining 80% interest in our unconsolidated JV in March 2022. |
| 6) | Excludes non-recurring capital expenditures of $17,390 and $6,438 for the three months ended December 31, 2022 and 2021, respectively and $60,350 and $22,547 for the year ended December 31, 2022 and 2021, respectively. |
Page 9
| Plymouth Industrial REIT, Inc. |
| Consolidated Balance Sheets |
| Unaudited ($ in thousands) |
| December 31, 2022 | December 31, 2021 | |||||||
| ASSETS | ||||||||
| Real estate properties: | ||||||||
| Land | $ | 231,829 | $ | 201,164 | ||||
| Building and improvements | 1,324,017 | 1,052,843 | ||||||
| Less accumulated depreciation | (205,629 | ) | (142,192 | ) | ||||
| Total real estate properties, net | $ | 1,350,217 | $ | 1,111,815 | ||||
| Cash, cash held in escrow and restricted cash | 31,213 | 43,374 | ||||||
| Deferred lease intangibles, net | 70,718 | 75,864 | ||||||
| Investment in unconsolidated joint venture1 | — | 5,833 | ||||||
| Interest rate swaps2 | 30,115 | — | ||||||
| Other assets | 39,055 | 33,919 | ||||||
| Total assets | $ | 1,521,318 | $ | 1,270,805 | ||||
| LIABILITIES, PREFERRED STOCK AND EQUITY | ||||||||
| Secured debt, net | $ | 389,531 | $ | 352,075 | ||||
| Unsecured debt, net3 | 524,845 | 335,840 | ||||||
| Accounts payable, accrued expenses and other liabilities | 72,551 | 66,880 | ||||||
| Deferred lease intangibles, net | 8,918 | 10,273 | ||||||
| Financing lease liability4 | 2,248 | 2,227 | ||||||
| Total liabilities | $ | 998,093 | $ | 767,295 | ||||
| Preferred stock - Series A | $ | 46,844 | $ | 48,473 | ||||
| Preferred stock - Series B5 | $ | — | $ | 94,437 | ||||
| Equity: | ||||||||
| Common stock | $ | 428 | $ | 361 | ||||
| Additional paid in capital | 635,068 | 532,666 | ||||||
| Accumulated deficit | (194,243 | ) | (177,258 | ) | ||||
| Accumulated other comprehensive income | 29,739 | — | ||||||
| Total stockholders' equity | 470,992 | 355,769 | ||||||
| Non-controlling interest | 5,389 | 4,831 | ||||||
| Total equity | $ | 476,381 | $ | 360,600 | ||||
| Total liabilities, preferred stock and equity | $ | 1,521,318 | $ | 1,270,805 | ||||
| 1) | Represents a noncontrolling equity interest in a single joint venture we entered into during October 2020. Our investment in the joint venture is accounted for under the equity method of accounting. The Company acquired the remaining 80% interest in the joint venture in March 2022. |
| 2) | Represents the fair value of the Company's interest rate swaps. A summary of the Company's interest rate swaps and accounting are detailed in Note 8 of our most recent Annual Report on Form 10-K. |
| 3) | Includes borrowings under line of credit and term loans. Refer to Debt Summary in this Supplemental Information for additional details. |
| 4) | As of December 31, 2022, we have a single finance lease in which we are the sublessee for a ground lease with a remaining lease term of approximately 33 years. Refer to our 2022 Annual Report on Form 10-K for expanded disclosure. |
| 5) | On April 29, 2022, 2,205,882 shares of the Company’s Series B Convertible Redeemable Preferred Stock were converted to our common stock on a one-to-one basis. On August 12, 2022, the holder of the Company's Series B Convertible Redeemable Preferred Stock informed the Company that it had elected to convert the remaining 2,205,882 shares of Series B Convertible Redeemable Preferred Stock into the Company's common stock. Pursuant to the terms of the Series B Convertible Redeemable Preferred Stock agreement, the Company elected a combination settlement comprised of 1,915,511 shares of common stock and $15,000 in cash, which was settled on August 17, 2022. |
Page 10
| Plymouth Industrial REIT, Inc. |
| Capital Structure and Debt Summary |
| Unaudited ($ in thousands) as of 12/31/2022 |
| Debt Summary |
| Secured Debt: | Maturity Date | Interest Rate | Commitment | Principal Balance | ||||||||
| AIG Loan | November-23 | 4.08% | $ | 120,000 | $ | 111,758 | ||||||
| Ohio National Life Mortgage1 | August-24 | 4.14% | 21,000 | 19,045 | ||||||||
| Allianz Loan | April-26 | 4.07% | 63,115 | 62,388 | ||||||||
| Nationwide Loan | October-27 | 2.97% | 15,000 | 15,000 | ||||||||
| Lincoln Life Gateway Mortgage1 | January-28 | 3.43% | 28,800 | 28,800 | ||||||||
| Minnesota Life Memphis Industrial Loan1 | January-28 | 3.15% | 56,000 | 56,000 | ||||||||
| Midland National Life Insurance Mortgage1 | March-28 | 3.50% | 10,820 | 10,820 | ||||||||
| Minnesota Life Loan | May-28 | 3.78% | 21,500 | 20,019 | ||||||||
| Transamerica Loan | August-28 | 4.35% | 78,000 | 67,398 | ||||||||
| Total / Weighted Average Secured Debt | 3.87% | $ | 414,235 | $ | 391,228 | |||||||
| Unsecured Debt: | ||||||||||||
| KeyBank Line of Credit | August-25 | 5.77% | 2 | $ | 350,000 | $ | 77,500 | |||||
| $100m KeyBank Term Loan | August-26 | 3.10% | 2,3 | 100,000 | 100,000 | |||||||
| $200m KeyBank Term Loan | February-27 | 3.13% | 2,3 | 200,000 | 200,000 | |||||||
| $150m KeyBank Term Loan | May-27 | 4.50% | 2,3 | 150,000 | 150,000 | |||||||
| Total / Weighted Average Unsecured Debt | 3.90% | $ | 800,000 | $ | 527,500 | |||||||
| December 31, | September 30, | June 30, | March 31, | |||||||||||||
| Net Debt: | 2022 | 2022 | 2022 | 2022 | ||||||||||||
| Total Debt4 | $ | 918,728 | $ | 910,293 | $ | 884,841 | $ | 864,783 | ||||||||
| Less: Cash | 31,213 | 36,253 | 36,066 | 42,269 | ||||||||||||
| Net Debt | $ | 887,515 | $ | 874,040 | $ | 848,775 | $ | 822,514 | ||||||||
| Capitalization |
| December 31, | September 30, | June 30, | March 31, | |||||||||||||
| 2022 | 2022 | 2022 | 2022 | |||||||||||||
| Common Shares and Units Outstanding5 | 43,339 | 43,339 | 40,623 | 37,476 | ||||||||||||
| Closing Price (as of period end) | $ | 19.18 | $ | 16.81 | $ | 17.54 | $ | 27.10 | ||||||||
| Market Value of Common Shares6 | $ | 831,242 | $ | 728,529 | $ | 712,527 | $ | 1,015,600 | ||||||||
| Preferred Stock - Series A (at liquidation preference) | 48,888 | 49,311 | 50,179 | 50,589 | ||||||||||||
| Preferred Stock - Series B (at liquidation preference)8 | — | — | 50,765 | 99,463 | ||||||||||||
| Total Market Capitalization6,7 | $ | 1,798,858 | $ | 1,688,133 | $ | 1,698,312 | $ | 2,030,435 | ||||||||
| Dividend / Share (annualized) | $ | 0.88 | $ | 0.88 | $ | 0.88 | $ | 0.88 | ||||||||
| Dividend Yield (annualized) | 4.6% | 5.2% | 5.0% | 3.2% | ||||||||||||
| Total Debt-to-Total Market Capitalization | 51.1% | 53.9% | 52.1% | 42.6% | ||||||||||||
| Secured Debt as a % of Total Debt | 42.6% | 43.2% | 44.6% | 45.8% | ||||||||||||
| Unsecured Debt as a % of Total Debt | 57.4% | 56.8% | 55.4% | 54.2% | ||||||||||||
| Net Debt-to-Annualized Adjusted EBITDA (quarter annualized) | 7.3 | x | 7.3 | x | 7.4 | x | 7.5 | x | ||||||||
| Net Debt plus Preferred-to-Annualized Adjusted EBITDA (quarter annualized) | 7.7 | x | 7.7 | x | 8.3 | x | 8.8 | x | ||||||||
| Weighted Average Maturity of Total Debt (years) | 3.7 | 4.0 | 4.2 | 4.2 | ||||||||||||
| Capital Markets Activity | ||||
| Common Shares | Avg. Price | Offering | Period | Net Proceeds |
| 614,800 | $ 28.43 | ATM | Q1 2022 | $ 17,123 |
| 927,900 | $ 26.85 | ATM | Q2 2022 | $ 24,384 |
| 802,547 | $ 21.35 | ATM | Q3 2022 | $ 16,812 |
| - | $ - | N/A | Q4 2022 | $ - |
| Refer to Glossary in this Supplemental Information for definitions of non-GAAP financial measures, including Net debt and Net debt plus preferred-to-Adjusted EBITDA. |
| 1) | Debt assumed at acquisition. |
| 2) | For the month of December 2022, the one-month term SOFR for our unsecured debt and borrowings under line of credit was 4.124%. The spread over the applicable rate for the $100m, $150m, and $200m KeyBank Term Loans and KeyBank unsecured line of credit is based on the Company’s total leverage ratio plus the 0.1% SOFR index adjustment. |
| 3) | As of December 31, 2022, the one-month term SOFR for the $100m, $150m and $200m KeyBank Term Loans was swapped to a fixed rate of 1.504%, 2.904%, and 1.5273%, respectively. See Notes 7 and 8 of our most recent Annual Report on Form 10-K for additional disclosure. |
| 4) | Total Debt is not adjusted for the amortization of debt issuance costs or fair market premiums or discounts. |
| 5) | Common shares and units outstanding were 42,849 and 490 as of December 31, 2022, respectively, and 36,111 and 490 for the year ended December 31, 2021, respectively. |
| 6) | Based on closing price as of last trading day of the quarter and common shares and units as of the period ended. |
| 7) | Market value of shares and units plus total debt and preferred stock as of period end. |
| 8) | On April 29, 2022, 2,205,882 shares of the Company’s Series B Convertible Redeemable Preferred Stock were converted to our common stock on a one-to-one basis. On August 12, 2022, the holder of the Company's Series B Convertible Redeemable Preferred Stock informed the Company that it had elected to convert the remaining 2,205,882 shares of Series B Convertible Redeemable Preferred Stock into the Company's common stock. |
Page 11
| Plymouth Industrial REIT, Inc. |
| Net Asset Value Components |
| Unaudited ($ in thousands) as of 12/31/2022 |
| Net Operating Income | 2022 Acquisitions | |||||||||
| Three Months Ended December 31, |
Acquisition | # of | Square | Purchase | Projected | ||||||
| Market | Date | Buildings | Footage | Price | Initial Yield | ||||||
| Pro Forma Net Operating Income (NOI) | Atlanta, GA | 1/20/2022 | 1 | 150,000 | $ 9,750 | 6.0% | |||||
| Total Operating NOI | $ | 33,090 | Jacksonville, FL | 2/7/2022 | 2 | 85,920 | 12,300 | 7.1% | |||
| Pro Forma Effect of New Lease Activity1 | 718 | Multiple | 2/24/2022 | 3 | 678,745 | 43,250 | 5.0% | ||||
| Pro Forma Effect of Acquisitions2 | - | Memphis, TN | 3/11/2022 | 28 | 2,320,773 | 102,355 | 6.6% | ||||
| Pro Forma Effect of Repositioning / Development3 | 521 | Memphis, TN | 3/11/2022 | 3 | 67,557 | 8,150 | 7.6% | ||||
| Pro Forma NOI | $ | 34,329 | Atlanta, GA | 3/15/2022 | 1 | 200,000 | 12,500 | 5.3% | |||
| St. Louis, MO | 4/6/2022 | 1 | 76,485 | 8,450 | 6.3% | ||||||
| Amortization of above / below market lease intangibles, net | (519) | Chicago, IL | 4/14/2022 | 1 | 78,743 | 7,300 | 5.5% | ||||
| Straight-line rental revenue adjustment | (637) | Multiple | 5/18/2022 | 2 | 153,903 | 12,700 | 5.8% | ||||
| Pro Forma Cash NOI | $ | 33,173 | Charlotte, NC | 5/19/2022 | 1 | 155,220 | 20,400 | 5.8% | |||
| Cleveland, OH | 7/7/2022 | 1 | 197,518 | 16,500 | 6.3% | ||||||
| 44 | 4,164,864 | $ 253,655 | 6.1% | ||||||||
| Other Assets and Liabilities | Developable Land | |||||||||
| Cash, cash held in escrow and restricted cash | $ | 31,213 | Owned | Developable | Under | Est. Investment / | Under | ||||
| Other assets | $ | 39,055 | Market | Land (acres)4 | GLA (SF)4 | Construction (SF)5 | Est. Completion | Development (SF)5 | |||
| CIP related to development properties | $ | 45,230 | Atlanta | 74 | 617,000 | 417,000 | $25.8M / Q2 '23 | - | |||
| Accounts payable, accrued expenses and other liabilities | $ | 72,551 | Chicago | 11 | 220,000 | - | - | ||||
| Cincinnati | 30 | 440,000 | 156,000 | $14.0M / Q2 '23 | 200,000 | ||||||
| Debt and Preferred Stock | Jacksonville | 15 | 176,000 | - | 176,000 | ||||||
| Memphis | 23 | 475,000 | - | - | |||||||
| Secured Debt | $ | 391,228 | St. Louis | 31 | 300,000 | - | - | ||||
| Unsecured Debt | $ | 527,500 | 184 | 2,228,000 | 573,000 | 376,000 | |||||
| Preferred Stock - Series A6 | $ | 48,888 | |||||||||
| Common shares and units outstanding7 | 43,339 | ||||||||||
We have made a number of assumptions with respect to the pro forma effects and there can be no assurance that we would have generated the projected levels of NOI had we actually owned the acquired properties and / or fully stabilized the repositioning / development properties as of the beginning of the period. Refer to Glossary in this Supplemental Information for a definition and discussion of non-GAAP financial measures.
| 1) | Represents the estimated incremental base rents from uncommenced new leases as if rent commencement had occurred as of the beginning of the period. |
| 2) | Represents the estimated impact of acquisitions as if they had been acquired at the beginning of the period. |
| 3) | Represents the estimated impact of properties that are undergoing repositioning or lease-up and development properties placed in-service as if the properties were stabilized and rents had commenced as of the beginning of the period. |
| 4) | Developable land represents acreage currently owned by us and identified for potential development. The developable gross leasable area (GLA) is based on the developable land area and a land to building ratio. Developable land and GLA are estimated and can change periodically due to changes in site design, road and storm water requirements, parking requirements and other factors. We have made a number of assumptions in such estimates and there can be no assurance that we will develop land that we own. |
| 5) | Under construction represents projects for which vertical construction has commenced. Under development represents projects in the pre-construction phase. |
| 6) | Preferred Stock is calculated at its liquidation preference as of the end of the period. |
| 7) | Common shares and units outstanding were 42,849 and 490, respectively, as of December 31, 2022. |
Page 12
| Plymouth Industrial REIT, Inc. |
| Leasing Activity and Expirations |
| Unaudited as of 12/31/2022 |
| Lease Renewals and New Leases1 |
| Year | Type | Square Footage | Percent | Expiring Rent | New Rent | % Change | Tenant Improvements $/SF/YR |
Lease Commissions $/SF/YR |
| 2020 | Renewals | 1,881,346 | 71.1% | $ 3.75 | $ 3.93 | 4.8% | $ 0.13 | $ 0.08 |
| New Leases | 764,314 | 28.9% | $ 4.31 | $ 5.07 | 17.6% | $ 0.24 | $ 0.19 | |
| Total | 2,645,660 | 100% | $ 3.92 | $ 4.26 | 8.7% | $ 0.16 | $ 0.11 | |
| 2021 | Renewals | 2,487,589 | 49.3% | $ 4.25 | $ 4.50 | 5.9% | $ 0.19 | $ 0.10 |
| New Leases | 2,557,312 | 50.7% | $ 3.76 | $ 4.40 | 17.0% | $ 0.23 | $ 0.22 | |
| Total | 5,044,901 | 100% | $ 4.00 | $ 4.45 | 11.1% | $ 0.21 | $ 0.16 | |
| Q1 2022 | Renewals | 955,416 | 73.0% | $ 4.36 | $ 4.91 | 12.6% | $ 0.22 | $ 0.17 |
| New Leases | 353,869 | 27.0% | $ 3.87 | $ 5.02 | 29.7% | $ 0.65 | $ 0.22 | |
| Total | 1,309,285 | 100% | $ 4.23 | $ 4.94 | 16.8% | $ 0.33 | $ 0.18 | |
| Q2 2022 | Renewals | 463,630 | 31.2% | $ 5.38 | $ 5.72 | 6.3% | $ 0.23 | $ 0.15 |
| New Leases | 1,020,021 | 68.8% | $ 3.64 | $ 4.84 | 33.0% | $ 0.35 | $ 0.28 | |
| Total | 1,483,651 | 100% | $ 4.18 | $ 5.11 | 22.2% | $ 0.31 | $ 0.24 | |
| Q3 2022 | Renewals | 1,455,328 | 57.0% | $ 4.18 | $ 4.70 | 12.4% | $ 0.23 | $ 0.15 |
| New Leases | 1,097,011 | 43.0% | $ 3.19 | $ 4.04 | 26.6% | $ 0.37 | $ 0.20 | |
| Total | 2,552,339 | 100% | $ 3.75 | $ 4.42 | 17.6% | $ 0.29 | $ 0.17 | |
| Q4 2022 | Renewals | 1,727,981 | 75.2% | $ 4.10 | $ 4.77 | 16.3% | $ 0.04 | $ 0.17 |
| New Leases | 570,625 | 24.8% | $ 3.65 | $ 4.51 | 23.6% | $ 0.40 | $ 0.22 | |
| Total | 2,298,606 | 100% | $ 3.99 | $ 4.71 | 18.1% | $ 0.29 | $ 0.18 | |
| Total 2022 | Renewals | 4,602,355 | 60.2% | $ 4.31 | $ 4.87 | 13.0% | $ 0.15 | $ 0.16 |
| New Leases | 3,041,526 | 39.8% | $ 3.51 | $ 4.51 | 28.5% | $ 0.40 | $ 0.23 | |
| Total | 7,643,881 | 100% | $ 3.99 | $ 4.73 | 18.5% | $ 0.25 | $ 0.19 |
| Lease Expiration Schedule | ||||||||||
| Year | Square Footage | ABR2 | % of ABR Expiring3 | 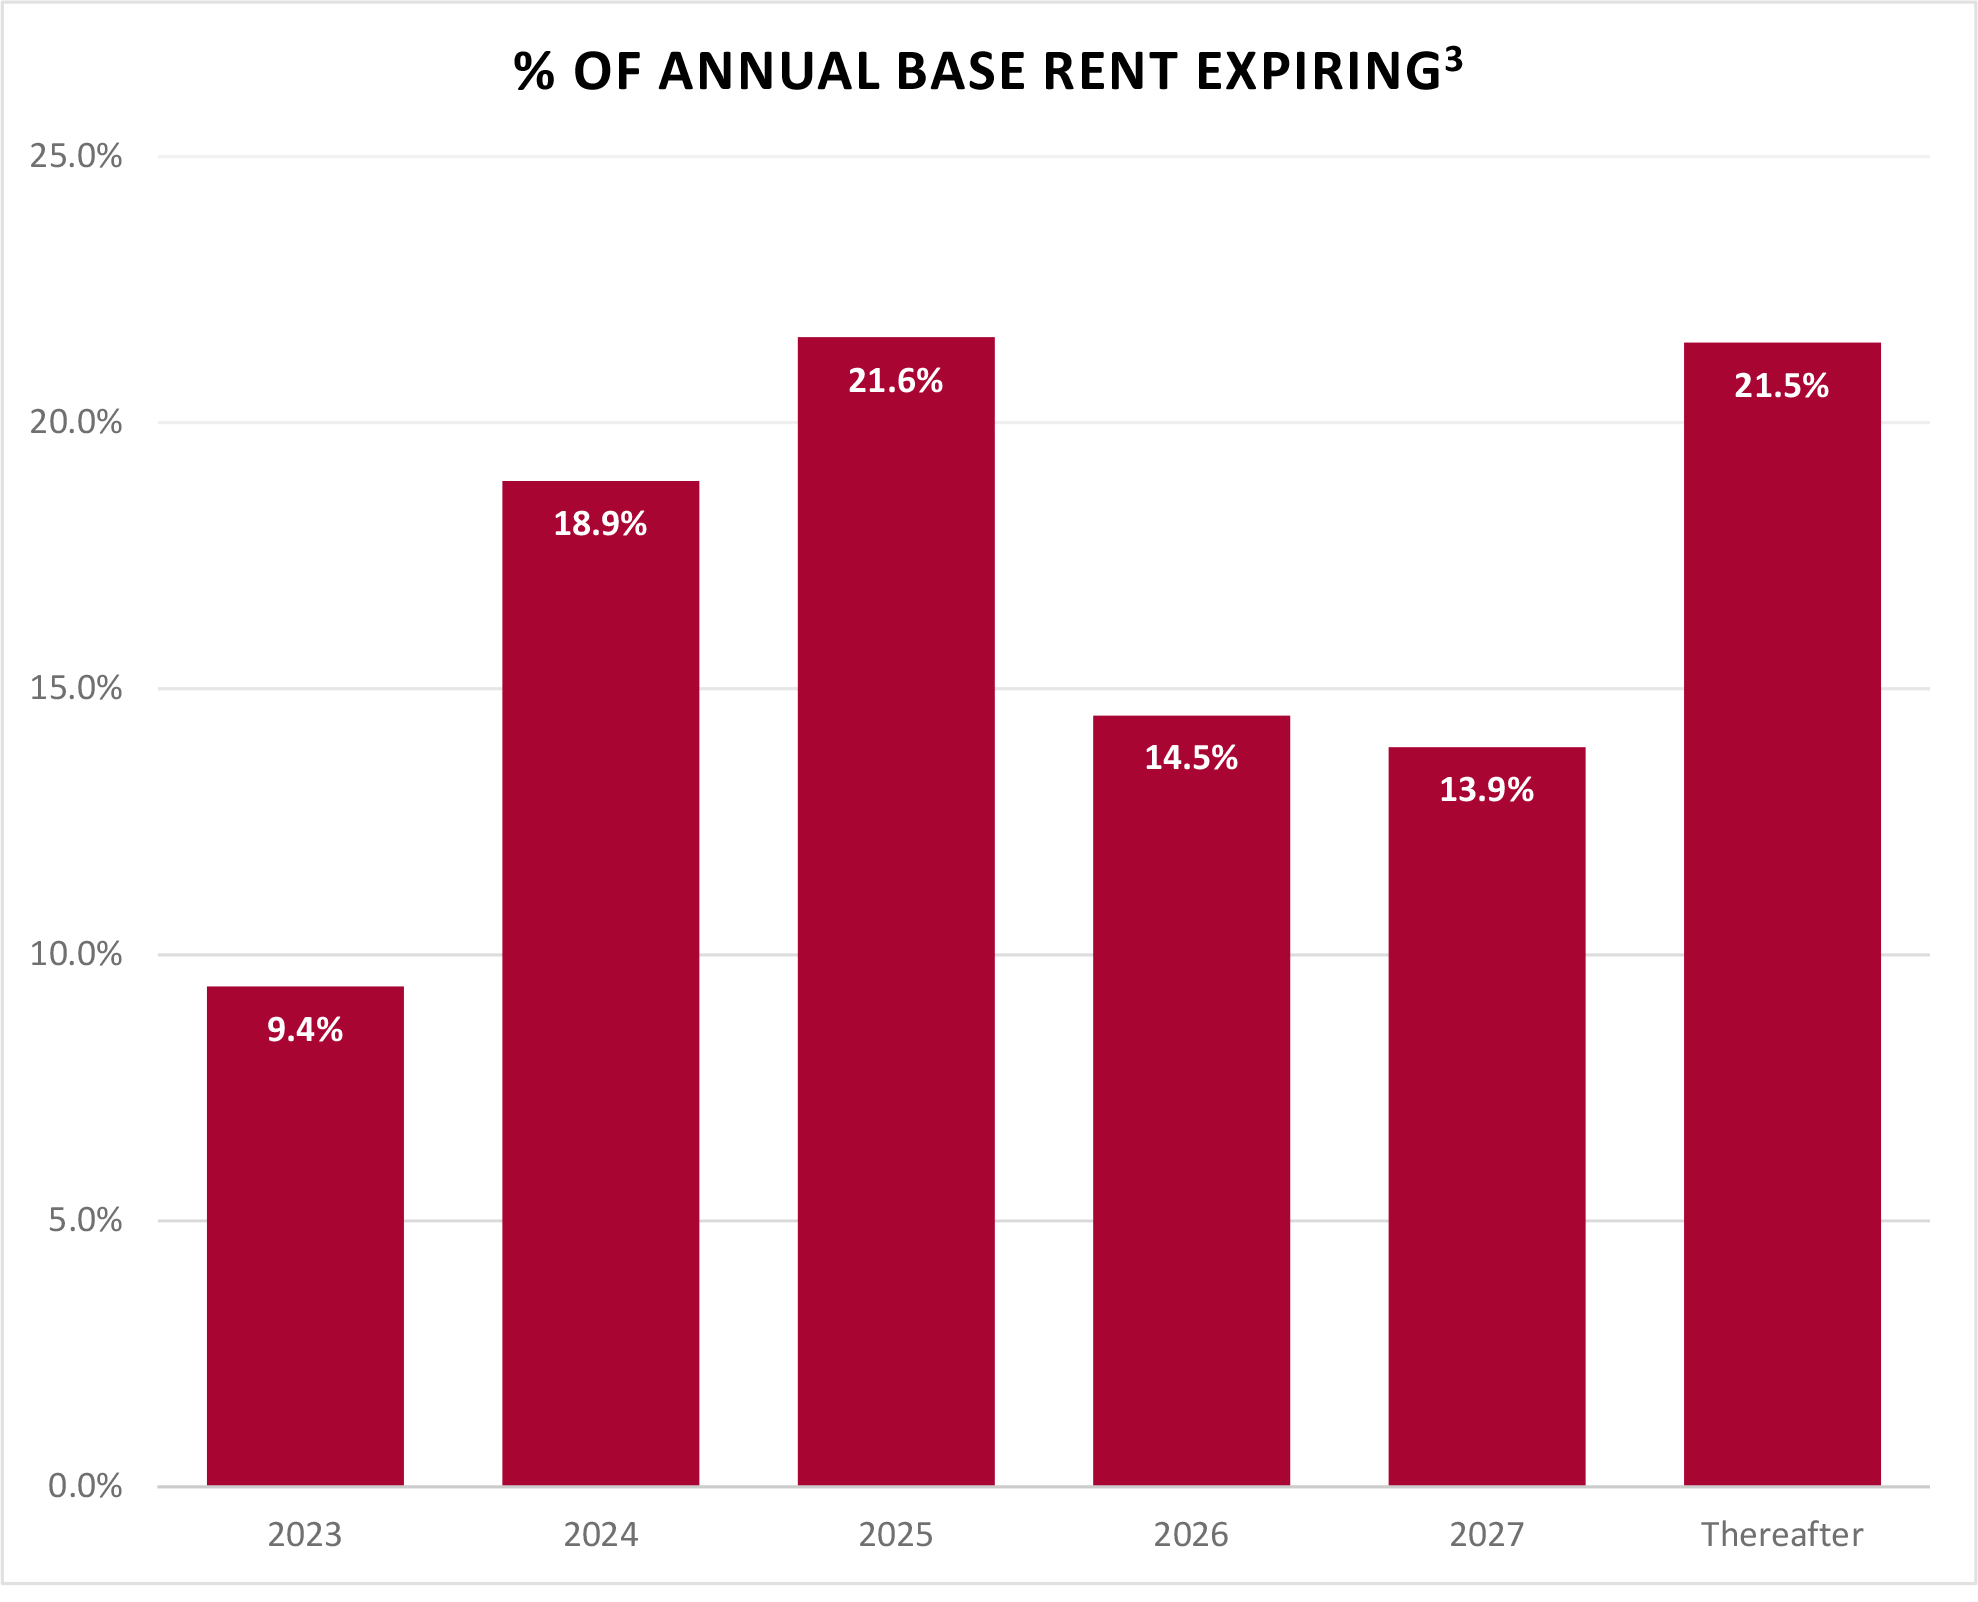 |
||||||
| Available | 328,308 | $ - | - | |||||||
| 2023 | 3,276,074 | 13,700,025 | 9.4% | |||||||
| 2024 | 6,565,204 | 27,365,683 | 18.9% | |||||||
| 2025 | 7,402,504 | 31,382,815 | 21.6% | |||||||
| 2026 | 4,447,610 | 21,062,479 | 14.5% | |||||||
| 2027 | 4,608,602 | 20,093,596 | 13.9% | |||||||
| Thereafter | 7,208,371 | 31,382,577 | 21.5% | |||||||
| Total | 33,836,673 | $ 144,987,175 | 100% | |||||||
| 1) | Lease renewals and new lease activity excludes leases with terms less than six months. |
| 2) | Annualized base rent is calculated as monthly contracted base rent as of December 31, 2022, multiplied by 12. Excludes rent abatements. |
| 3) | Calculated as annualized base rent set forth in this table divided by total annualized base rent as of December 31, 2022. |
Page 13
| Plymouth Industrial REIT, Inc. |
| Leased Square Feet and Annualized Base Rent by Tenant Industry |
| Unaudited as of 12/31/2022 |
| Industry | Total Leased Square Feet |
# of Leases | % Rentable Square Feet |
ABR1 | % ABR | ABR Per Square Foot |
| Logistics & Transportation | 9,807,690 | 89 | 29.3% | $ 39,029,677 | 26.9% | $ 3.98 |
| Automotive | 2,375,092 | 27 | 7.1% | 10,766,624 | 7.4% | 4.53 |
| Wholesale/Retail | 2,359,107 | 32 | 7.0% | 10,514,719 | 7.3% | 4.46 |
| Food & Beverage | 1,898,596 | 25 | 5.7% | 8,803,442 | 6.1% | 4.64 |
| Printing & Paper | 1,872,092 | 16 | 5.6% | 7,075,496 | 4.9% | 3.78 |
| Home & Garden | 1,841,386 | 18 | 5.5% | 6,048,555 | 4.2% | 3.28 |
| Construction | 1,773,623 | 42 | 5.3% | 7,727,681 | 5.3% | 4.36 |
| Cardboard and Packaging | 1,558,027 | 18 | 4.6% | 6,018,467 | 4.2% | 3.86 |
| Light Manufacturing | 1,234,493 | 12 | 3.7% | 4,390,616 | 3.0% | 3.56 |
| Education | 926,896 | 8 | 2.8% | 4,402,215 | 3.0% | 4.75 |
| Other Industries* | 7,861,363 | 233 | 23.4% | 40,209,683 | 27.7% | 5.11 |
| Total | 33,508,365 | 520 | 100.0% | $ 144,987,175 | 100.0% | $ 4.33 |
| *Other Industries | Total Leased Square Feet |
# of Leases | % Rentable Square Feet |
ABR1 | % ABR | ABR Per Square Foot |
| Plastics | 923,441 | 14 | 2.8% | $ 4,169,575 | 2.8% | $ 4.52 |
| Healthcare | 865,609 | 39 | 2.5% | 5,016,824 | 3.4% | 5.80 |
| Industrial Equipment Components | 769,430 | 20 | 2.3% | 3,160,821 | 2.2% | 4.11 |
| Metal Fabrication/Finishing | 660,472 | 11 | 2.0% | 3,177,600 | 2.2% | 4.81 |
| Technology & Electronics | 534,515 | 19 | 1.6% | 3,235,918 | 2.2% | 6.05 |
| Chemical | 527,632 | 9 | 1.6% | 2,059,806 | 1.4% | 3.90 |
| Storage | 520,540 | 10 | 1.6% | 2,862,042 | 2.0% | 5.50 |
| Aero Space | 455,605 | 3 | 1.4% | 1,411,217 | 1.0% | 3.10 |
| Business Services | 435,852 | 26 | 1.3% | 3,343,001 | 2.3% | 7.67 |
| Plumbing Equipment/Services | 404,712 | 7 | 1.2% | 1,543,003 | 1.1% | 3.81 |
| Other2 | 1,763,555 | 75 | 5.1% | 10,229,876 | 7.1% | 5.80 |
| Total | 7,861,363 | 233 | 23.4% | $ 40,209,683 | 27.7% | $ 5.11 |
| 1) | Annualized base rent is calculated as monthly contracted base rent as of December 31, 2022, multiplied by 12. Excludes rent abatements. |
| 2) | Includes tenant industries for which the total leased square feet aggregates to less than 300,000 square feet. |
Page 14
| Plymouth Industrial REIT, Inc. | ||||
| Leased Square Feet and Annualized Base Rent by Type | ||||
| Unaudited as of 12/31/2022 | ||||
| Leased Square Feet and Annualized Base Rent by Lease Type | ||||
| Lease Type | Total Leased Square Feet |
# of Leases | % Leased Square Feet |
ABR1 | % ABR | ABR Per Square Foot | |
| Triple Net | 27,157,065 | 405 | 81.1% | $ 114,345,641 | 78.8% | $ 4.21 | |
| Modified Net | 3,229,260 | 53 | 9.6% | 15,628,870 | 10.8% | 4.84 | |
| Gross | 3,122,040 | 62 | 9.3% | 15,012,664 | 10.4% | 4.81 | |
| Total | 33,508,365 | 520 | 100.0% | $ 144,987,175 | 100.0% | $ 4.33 |
| Leased Square Feet and Annualized Base Rent by Tenant Type |
| Tenant Type | Total Leased Square Feet |
# of Leases | % Leased Square Feet |
ABR1 | % ABR | ABR Per Square Foot | |
| Multi-Tenant | 17,098,800 | 418 | 51.0% | $ 80,035,357 | 55.2% | $ 4.68 | |
| Single-Tenant | 16,409,565 | 102 | 49.0% | 64,951,818 | 44.8% | 3.96 | |
| Total | 33,508,365 | 520 | 100.0% | $ 144,987,175 | 100.0% | $ 4.33 |
| Leased Square Feet and Annualized Base Rent by Building Type |
| Building Type | Total Leased Square Feet |
# of Buildings | % Leased Square Feet |
ABR1 | % ABR | ABR Per Square Foot | |
| Warehouse/Distribution | 21,561,878 | 118 | 64.4% | $ 83,330,591 | 57.5% | $ 3.86 | |
| Warehouse/Light Manufacturing | 8,648,474 | 40 | 25.8% | 37,839,023 | 26.1% | 4.38 | |
| Small Bay Industrial2 | 3,298,013 | 50 | 9.8% | 23,817,561 | 16.4% | 7.22 | |
| Total | 33,508,365 | 208 | 100.0% | $ 144,987,175 | 100.0% | $ 4.33 | |
| 1) | Annualized base rent is calculated as monthly contracted base rent as of December 31, 2022, multiplied by 12. Excludes rent abatements. |
| 2) | Small bay industrial is inclusive of flex space totaling 500,294 leased square feet and annualized base rent of $5,885,143. Small bay industrial is multipurpose space; flex space includes office space that accounts for greater than 50% of the total rentable area. |
Page 15
| Plymouth Industrial REIT, Inc. | |
| Top 10 Tenants by Annualized Base Rent | |
| Unaudited as of 12/31/2022 | |
| Tenant | Market | Industry | # of Leases | Total Leased Square Feet |
Expiration | ABR Per Square Foot |
ABR1 | % Total ABR |
| FedEx Supply Chain, Inc. | St. Louis | Logistics & Transportation | 1 | 769,500 | 7/31/2024 | $ 4.50 | $ 3,461,981 | 2.4% |
| Geodis Logistics, LLC | St. Louis | Logistics & Transportation | 1 | 624,159 | 8/31/2025 | 4.25 | 2,652,676 | 1.8% |
| Royal Canin U.S.A, Inc. | St. Louis | Wholesale/Retail | 1 | 521,171 | 5/31/2025 | 4.75 | 2,475,562 | 1.7% |
| Houghton Mifflin Harcourt Company | Chicago | Education | 1 | 513,512 | 3/31/2026 | 4.49 | 2,305,669 | 1.6% |
| ODW Logistics, Inc. | Columbus | Logistics & Transportation | 1 | 772,450 | 6/30/2025 | 2.93 | 2,261,284 | 1.6% |
| Archway Marketing Holdings, Inc. | Chicago | Logistics & Transportation | 3 | 503,000 | 3/31/2026 | 4.40 | 2,213,260 | 1.5% |
| ASW Supply Chain Services, LLC | Cleveland | Logistics & Transportation | 5 | 577,237 | 12/31/2023 | 3.58 | 2,065,130 | 1.4% |
| Balta US, Inc. | Jacksonville | Home & Garden | 2 | 629,084 | 12/31/2028 | 3.07 | 1,933,607 | 1.3% |
| Communications Test Design, Inc. | Memphis | Logistics & Transportation | 2 | 566,281 | 12/31/2024 | 3.28 | 1,855,850 | 1.3% |
| Winston Products, LLC | Cleveland | Automotive | 2 | 266,803 | 4/30/2032 | 6.81 | 1,816,650 | 1.3% |
| Total Largest Tenants by Annualized Rent | 19 | 5,743,197 | $ 4.01 | $ 23,041,669 | 15.9% | |||
| All Other Tenants | 501 | 27,765,168 | $ 4.39 | $ 121,945,506 | 84.1% | |||
| Total Company Portfolio | 520 | 33,508,365 | $ 4.33 | $ 144,987,175 | 100.0% | |||
| Lease Segmentation by Size |
| Square Feet | # of Leases | Total Leased Square Feet |
Total Rentable Square Feet |
Total Leased % |
Total Leased % Excluding Repositioning2 |
ABR1 | In-Place + Uncommenced ABR3 |
% of Total In-Place + Uncommenced ABR |
In-Place + Uncommenced ABR Per SF4 |
| < 4,999 | 65 | 171,826 | 254,050 | 67.6% | 69.1% | $ 1,667,504 | $ 2,910,085 | 2.0% | $ 15.89 |
| 5,000 - 9,999 | 77 | 540,104 | 622,050 | 86.8% | 88.6% | 4,482,502 | 4,580,002 | 3.1% | 8.36 |
| 10,000 - 24,999 | 113 | 1,909,949 | 1,957,758 | 97.6% | 99.2% | 13,152,909 | 13,152,909 | 9.0% | 6.89 |
| 25,000 - 49,999 | 93 | 3,252,407 | 3,368,736 | 96.5% | 96.5% | 18,038,276 | 18,038,276 | 12.3% | 5.55 |
| 50,000 - 99,999 | 77 | 5,320,516 | 5,320,516 | 100.0% | 100.0% | 23,264,804 | 23,264,804 | 15.9% | 4.37 |
| 100,000 - 249,999 | 64 | 10,289,593 | 10,289,593 | 100.0% | 100.0% | 41,657,833 | 41,657,833 | 28.5% | 4.05 |
| > 250,000 | 31 | 12,023,970 | 12,023,970 | 100.0% | 100.0% | 42,723,347 | 42,723,347 | 29.2% | 3.55 |
| Total / Weighted Average | 520 | 33,508,365 | 33,836,673 | 99.0% | 99.2% | $ 144,987,175 | $146,327,256 | 100.0% | $ 4.36 |
| 1) | Annualized base rent is calculated as monthly contracted base rent as of December 31, 2022, multiplied by 12. Excludes rent abatements. |
| 2) | Total Leased % Excluding Repositioning excludes vacant square footage being refurbished or repositioned. |
| 3) | In-Place + Uncommenced ABR calculated as in-place current annualized base rent as of December 31, 2022 plus annualized base rent for leases signed but not commenced as of December 31, 2022. |
| 4) | In-Place + Uncommenced ABR per SF is calculated as in-place current rent annualized base rent as of December 31, 2022 plus annualized base rent for leases signed but not commenced as of December 31, 2022, divided by leased square feet plus uncommenced leased square feet. |
Page 16
| Plymouth Industrial REIT, Inc. |
| Rentable Square Feet and Annualized Base Rent by Market |
| Unaudited ($ in thousands) as of 12/31/2022 |
| Primary Markets1 | ||||||||
| Total Rentable |
% Rentable |
|||||||
| # of Properties | # of Buildings | Occupancy | Square Feet | Square Feet | ABR2 | % ABR | ||
| Atlanta | 10 | 11 | 99.9% | 1,670,235 | 4.9% | $ 6,834 | 4.7% | |
| Chicago | 40 | 41 | 99.9% | 6,930,887 | 20.4% | 30,621 | 21.0% | |
| Secondary Markets1 | ||||||||
| Total Rentable |
% Rentable |
|||||||
| # of Properties | # of Buildings | Occupancy | Square Feet | Square Feet | ABR2 | % ABR | ||
| Boston | 1 | 2 | 87.6% | 268,713 | 0.8% | $ 1,729 | 1.2% | |
| Charlotte | 1 | 1 | 100.0% | 155,220 | 0.5% | 1,184 | 0.8% | |
| Cincinnati | 10 | 11 | 98.6% | 2,556,272 | 7.6% | 9,703 | 6.7% | |
| Cleveland | 16 | 19 | 98.9% | 3,979,209 | 11.8% | 18,252 | 12.6% | |
| Columbus | 15 | 15 | 100.0% | 3,757,614 | 11.1% | 13,132 | 9.1% | |
| Indianapolis | 17 | 17 | 98.3% | 4,085,169 | 12.1% | 15,449 | 10.7% | |
| Jacksonville | 8 | 26 | 98.2% | 2,052,074 | 6.1% | 13,864 | 9.6% | |
| Kansas City | 1 | 1 | 100.0% | 221,911 | 0.7% | 833 | 0.6% | |
| Memphis | 25 | 49 | 98.4% | 4,783,046 | 14.0% | 17,502 | 12.1% | |
| Philadelphia | 1 | 1 | 99.8% | 156,634 | 0.5% | 1,041 | 0.7% | |
| St. Louis | 12 | 14 | 99.3% | 3,219,689 | 9.5% | 14,843 | 10.2% | |
| Total | 157 | 208 | 99.0% | 33,836,673 | 100.0% | $ 144,987 | 100.0% | |
| Total Acquisition and Replacement Cost by Market | |||||||
| Market | State | # of Buildings | Total Acquisition Cost3 | Gross Real Estate Assets4 | % Gross Real Estate Assets | Replacement Cost5 | |
| Atlanta | GA | 11 | $ 85,181 | $ 78,275 | 5.2% | $ 128,303 | |
| Chicago | IL, IN, WI | 41 | 290,026 | 282,389 | 18.7% | 748,811 | |
| Boston | ME | 2 | 10,500 | 18,808 | 1.3% | 40,729 | |
| Charlotte | NC | 1 | 20,400 | 18,999 | 1.3% | 20,821 | |
| Cincinnati | OH, KY | 11 | 91,664 | 92,558 | 6.2% | 177,351 | |
| Cleveland | OH | 19 | 201,550 | 189,921 | 12.6% | 362,436 | |
| Columbus | OH | 15 | 157,624 | 148,450 | 9.9% | 293,943 | |
| Indianapolis | IN | 17 | 149,251 | 140,769 | 9.4% | 356,416 | |
| Jacksonville | FL, GA | 26 | 147,950 | 135,469 | 9.0% | 207,038 | |
| Kansas City | MO | 1 | 8,600 | 9,027 | 0.6% | 20,451 | |
| Memphis | MS, TN | 49 | 185,407 | 178,416 | 11.9% | 349,852 | |
| Philadelphia | NJ | 1 | 9,700 | 8,708 | 0.6% | 14,912 | |
| St. Louis | IL, MO | 14 | 213,787 | 200,968 | 13.3% | 325,818 | |
| Total | 208 | $ 1,571,640 | $ 1,502,757 | 100.0% | $ 3,046,881 | ||
| 1) | Primary markets means the following two metropolitan areas in the U.S., each generally consisting of more than 300 million square feet of industrial space: Chicago and Atlanta. Secondary markets means non-primary markets, each generally consisting of between 100 million and 300 million square feet of industrial space, including the following metropolitan areas in the U.S.: Boston, Charlotte, Cincinnati, Cleveland, Columbus, Indianapolis, Jacksonville, Kansas City, Memphis, Milwaukee, Philadelphia, South Florida, and St. Louis. Our definitions of primary and secondary markets may vary from the definitions of these terms used by investors, analysts, or other industrial REITs. |
| 2) | Annualized base rent is calculated as monthly contracted base rent as of December 31, 2022, multiplied by 12. Excludes rent abatements. |
| 3) | Represents total direct consideration paid prior to the allocations per U.S. GAAP. |
| 4) | The gross book value of real estate assets as of December 31, 2022 excludes development projects of $45,317, $2,425 in leasehold improvements and assets related to corporate activities, our regional property management office in Columbus of $4,476, and the finance lease right-of-use asset of $871 related to the ground sublease at 2100 International Parkway. Gross book value of real estate assets excludes depreciation and the allocation of the acquisition cost related to intangible assets and liabilities required by U.S. GAAP. |
| 5) | Replacement cost is based on the Marshall & Swift valuation methodology for the determination of building costs. Replacement cost includes land reflected at the allocated cost in accordance with GAAP. |
Page 17
| Plymouth Industrial REIT, Inc. | ||||
| Glossary | ||||
| This glossary contains additional details for sections throughout this Supplemental Information, including explanations and reconciliations of certain non-GAAP financial measures, and the reasons why we use these supplemental measures of performance and believe they provide useful information to investors. Additional detail can be found in our most recent annual report on Form 10-K and subsequent quarterly reports on Form 10-Q, as well as other documents filed with or furnished to the SEC from time to time. | |||||
| Non-GAAP Financial Measures Definitions: | |||
| Net Operating Income (NOI): We consider net operating income, or NOI, to be an appropriate supplemental measure to net income in that it helps both investors and management understand the core operations of our properties. We define NOI as total revenue (including rental revenue and tenant reimbursements) less property-level operating expenses. NOI excludes depreciation and amortization, general and administrative expenses, impairments, gain/loss on sale of real estate, interest expense, and other non-operating items. | |||
| Cash Net Operating Income - (Cash NOI): We define Cash NOI as NOI excluding straight-line rent adjustments and amortization of above and below market leases. | |||
| EBITDAre and Adjusted EBITDA: We define earnings before interest, taxes, depreciation and amortization for real estate in accordance with the standards established by the National Association of Real Estate Investment Trusts (“NAREIT”). EBITDAre represents net income (loss), computed in accordance with GAAP, before interest expense, tax, depreciation and amortization, gains or losses on the sale of rental property, appreciation/(depreciation) of warrants, loss on impairments, and loss on extinguishment of debt. We calculate Adjusted EBITDA by adding or subtracting from EBITDAre the following items: (i) non-cash stock compensation, (ii) gain (loss) on extinguishment of debt, (iii) acquisition expenses (iv) the proforma impacts of acquisitions, dispositions and developments and (v) non-cash impairments on real estate lease. We believe that EBITDAre and Adjusted EBITDA are helpful to investors as supplemental measures of our operating performance as a real estate company as they are direct measures of the actual operating results of our industrial properties. EBITDAre and Adjusted EBITDA should not be used as measures of our liquidity and may not be comparable to how other REITs' calculate EBITDAre and Adjusted EBITDA. | |||
| Funds From Operations ("FFO"): Funds from operations, or FFO, is a non-GAAP financial measure that is widely recognized as a measure of REIT operating performance. We consider FFO to be an appropriate supplemental measure of our operating performance as it is based on a net income analysis of property portfolio performance that excludes non-cash items such as depreciation. The historical accounting convention used for real estate assets requires straight-line depreciation of buildings and improvements, which implies that the value of real estate assets diminishes predictably over time. Since real estate values rise and fall with market conditions, presentations of operating results for a REIT using historical accounting for depreciation could be less informative. In December 2018, NAREIT issued a white paper restating the definition of FFO. The purpose of the restatement was not to change the fundamental definition of FFO, but to clarify existing NAREIT guidance. The restated definition of FFO is as follows: Net Income (calculated in accordance with GAAP), excluding: (i) Depreciation and amortization related to real estate, (ii) Gains and losses from the sale of certain real estate assets, (iii) Gain and losses from change in control, and (iv) Impairment write-downs of certain real estate assets and investments in entities when the impairment is directly attributable to decreases in the value of depreciable real estate held by the entity. We define FFO consistent with the NAREIT definition. Adjustments for unconsolidated partnerships and joint ventures will be calculated to reflect FFO on the same basis. Other equity REITs may not calculate FFO as we do, and accordingly, our FFO may not be comparable to such other REITs’ FFO. FFO should not be used as a measure of our liquidity, and is not indicative of funds available for our cash needs, including our ability to pay dividends. | |||
| Core Funds from Operations (“Core FFO”): Core FFO represents FFO reduced by dividends paid (or declared) to holders of our preferred stock, acquisition and transaction related costs for transactions not completed, and excludes certain non-cash operating expenses such as impairment on real estate lease, appreciation/(depreciation) of warrants and loss on extinguishment of debt. As with FFO, our reported Core FFO may not be comparable to other REITs’ Core FFO, should not be used as a measure of our liquidity, and is not indicative of our funds available for our cash needs, including our ability to pay dividends. | |||
| Adjusted Funds from Operations attributable to common stockholders (“AFFO”): Adjusted funds from operations, or AFFO, is presented in addition to Core FFO. AFFO is defined as Core FFO, excluding certain non-cash operating revenues and expenses, capitalized interest, and recurring capitalized expenditures. Recurring capitalized expenditures include expenditures required to maintain and re-tenant our properties, tenant improvements and leasing commissions. AFFO further adjusts Core FFO for certain other non-cash items, including the amortization or accretion of above or below market rents included in revenues, straight line rent adjustments, non-cash equity compensation and non-cash interest expense. We believe AFFO provides a useful supplemental measure of our operating performance because it provides a consistent comparison of our operating performance across time periods that is comparable for each type of real estate investment and is consistent with management’s analysis of the operating performance of our properties. As a result, we believe that the use of AFFO, together with the required GAAP presentations, provide a more complete understanding of our operating performance. As a result, we believe that the use of AFFO, together with the required GAAP presentations, provide a more complete understanding of our operating performance. As with Core FFO, our reported AFFO may not be comparable to other REITs’ AFFO, should not be used as a measure of our liquidity, and is not indicative of our funds available for our cash needs, including our ability to pay dividends. | |||
| Net Debt and Preferred Stock to Adjusted EBITDA: Net debt and preferred stock to Adjusted EBITDA is a non-GAAP financial measure that we believe is useful to investors as a supplemental measure in evaluating balance sheet leverage. Net debt and preferred stock is equal to the sum of total consolidated and our pro rata share of unconsolidated joint venture debt less cash, cash equivalents, and restricted cash, plus preferred stock calculated at its liquidation preference as of the end of the period. | |||
Page 18
| Plymouth Industrial REIT, Inc. | ||||
| Glossary | ||||
| This glossary contains additional details for sections throughout this Supplemental Information, including explanations and reconciliations of certain non-GAAP financial measures, and the reasons why we use these supplemental measures of performance and believe they provide useful information to investors. Additional detail can be found in our most recent annual report on Form 10-K and subsequent quarterly reports on Form 10-Q, as well as other documents filed with or furnished to the SEC from time to time. | |||||
| Other Definitions: | |||||||||||||
| GAAP: U.S. generally accepted accounting principles. | |||||||||||||
| Lease Type: We define our triple net leases in that the tenant is responsible for all aspects of and costs related to the property and its operation during the lease term. We define our modified net leases in that the landlord is responsible for some property related expenses during the lease term, but the cost of most of the expenses is passed through to the tenant. We define our gross leases in that the landlord is responsible for all aspects of and costs related to the property and its operation during the lease term. | |||||||||||||
| Non-Recurring Capital Expenditures: Non-recurring capital expenditures include capital expenditures of long lived improvements required to upgrade/replace existing systems or items that previously did not exist. Non-recurring capital expenditures also include costs associated with repositioning a property, redevelopment/development and capital improvements known at the time of acquisition. | |||||||||||||
| Occupancy: We define occupancy as the percentage of total leasable square footage as the earlier of lease term commencement or revenue recognition in accordance to GAAP as of the close of the reporting period. | |||||||||||||
| Recurring Capital Expenditures: Recurring capitalized expenditures includes capital expenditures required to maintain and re-tenant our buildings, tenant improvements and leasing commissions. | |||||||||||||
| Replacement Cost: is based on the Marshall & Swift valuation methodology for the determination of building costs. The Marshall & Swift building cost data and analysis is widely recognized within the U.S. legal system and has been written into in law in over 30 U.S. states and recognized in the U.S. Treasury Department Internal Revenue Service Publication. Replacement cost includes land reflected at the allocated cost in accordance with Financial Accounting Standards Board ("FASB") ASC 805. | |||||||||||||
| Same Store Portfolio: The Same Store Portfolio is a subset of the consolidated portfolio and includes properties that are wholly owned by the Company as of December 31, 2020. The Same Store Portfolio is evaluated and defined on an annual basis based on the growth and size of the consolidated portfolio. The Same Store Portfolio excludes properties that were or will be classified as repositioning or lease-up during 2021 and 2022. For 2022, the Same Store Portfolio consists of 99 properties aggregating 21,962 million rentable square feet. Properties that are being repositioned generally are defined as those properties where a significant amount of space is held vacant in order to implement capital improvements that enhance the functionality, rental cash flows, and value of that property. We define a significant amount of space at a property using both the size of the space and its proportion to the properties total square footage as a determinate. Our computation of same store NOI may not be comparable to other REITs. | |||||||||||||
| Weighted Average Lease Term Remaining: The average contractual lease term remaining as of the close of the reporting period (in years) weighted by square footage. | |||||||||||||
Page 19